
Email marketing remains one of the few channels agencies and brands truly own—with returns holding steady around $36–$42 per $1 spent even as paid costs rise.
But in 2025, tracking email success looks different. Between privacy updates, AI-assisted inboxes, and engagement decay, understanding your email analytics isn’t optional—it’s how you decide where to focus budget and creative effort.
TL;DR
- Track two lenses: Email performance (OR, CTR, CTOR, unsub, deliverability) + Subscriber activity (growth, engagement, list health).
- Protect reputation & health: Monitor deliverability by domain, authenticate (SPF/DKIM/DMARC), and reactivate or suppress inactive subscribers.
- Optimize continuously: A/B test subject lines/CTAs, surface top-clicked content, tune frequency/segments, and refine journeys based on results.
- Operationalize in one place: Use Campaign Monitor Reports & Insights to review KPIs, journey stats, and link clicks on a weekly/monthly/quarterly cadence.

Choosing the right ESP? Compare the top email marketing platforms for agencies to see which ones offer the strongest analytics and reporting tools.
Why email insights are critical to your business
Modern marketers juggle more channels and tools than ever—but limited time and resources. Growth now depends less on doing more and more on knowing what’s actually working.
Looking at your performance in aggregate (not campaign by campaign) helps you:
- Spot trends instead of chasing one-off spikes.
- Compare channels to see where email outperforms social or paid.
- Focus effort on the tactics and segments driving real ROI.
This broader, aggregate-level view matters more than ever to spot trends. Privacy updates (like Apple Mail Privacy Protection and Gmail’s AI-summarized inbox) have blurred traditional signals such as “open rate.” Relying only on individual campaign metrics can create a false sense of success.
As a rule of thumb, healthy list engagement grows 5–10% quarter over quarter, unsubscribe rates stay under 0.2%, and click-through rates average 2–3% for most industries.
Using analytics to drive strategy


Marketers now have more visibility into customer behavior than ever—yet also more blind spots.
AI-driven inboxes, privacy regulations, and cookie deprecation have changed which metrics you can actually trust.
To keep your strategy sharp, focus on the ones that reveal what’s really happening: engagement momentum, content resonance, and audience health.
Track indicators that show direction, not vanity:
- Engagement velocity: Are subscribers interacting faster or slower after signup?
- Retention curve: How long does engagement last before dropping off?
- Content resonance: Which message types (story, offer, education) sustain the highest click depth?
Before diving into the specifics around measurement, we’ll explore some of the fundamental concepts of a solid and profitable email marketing strategy: engagement, growth, and health.
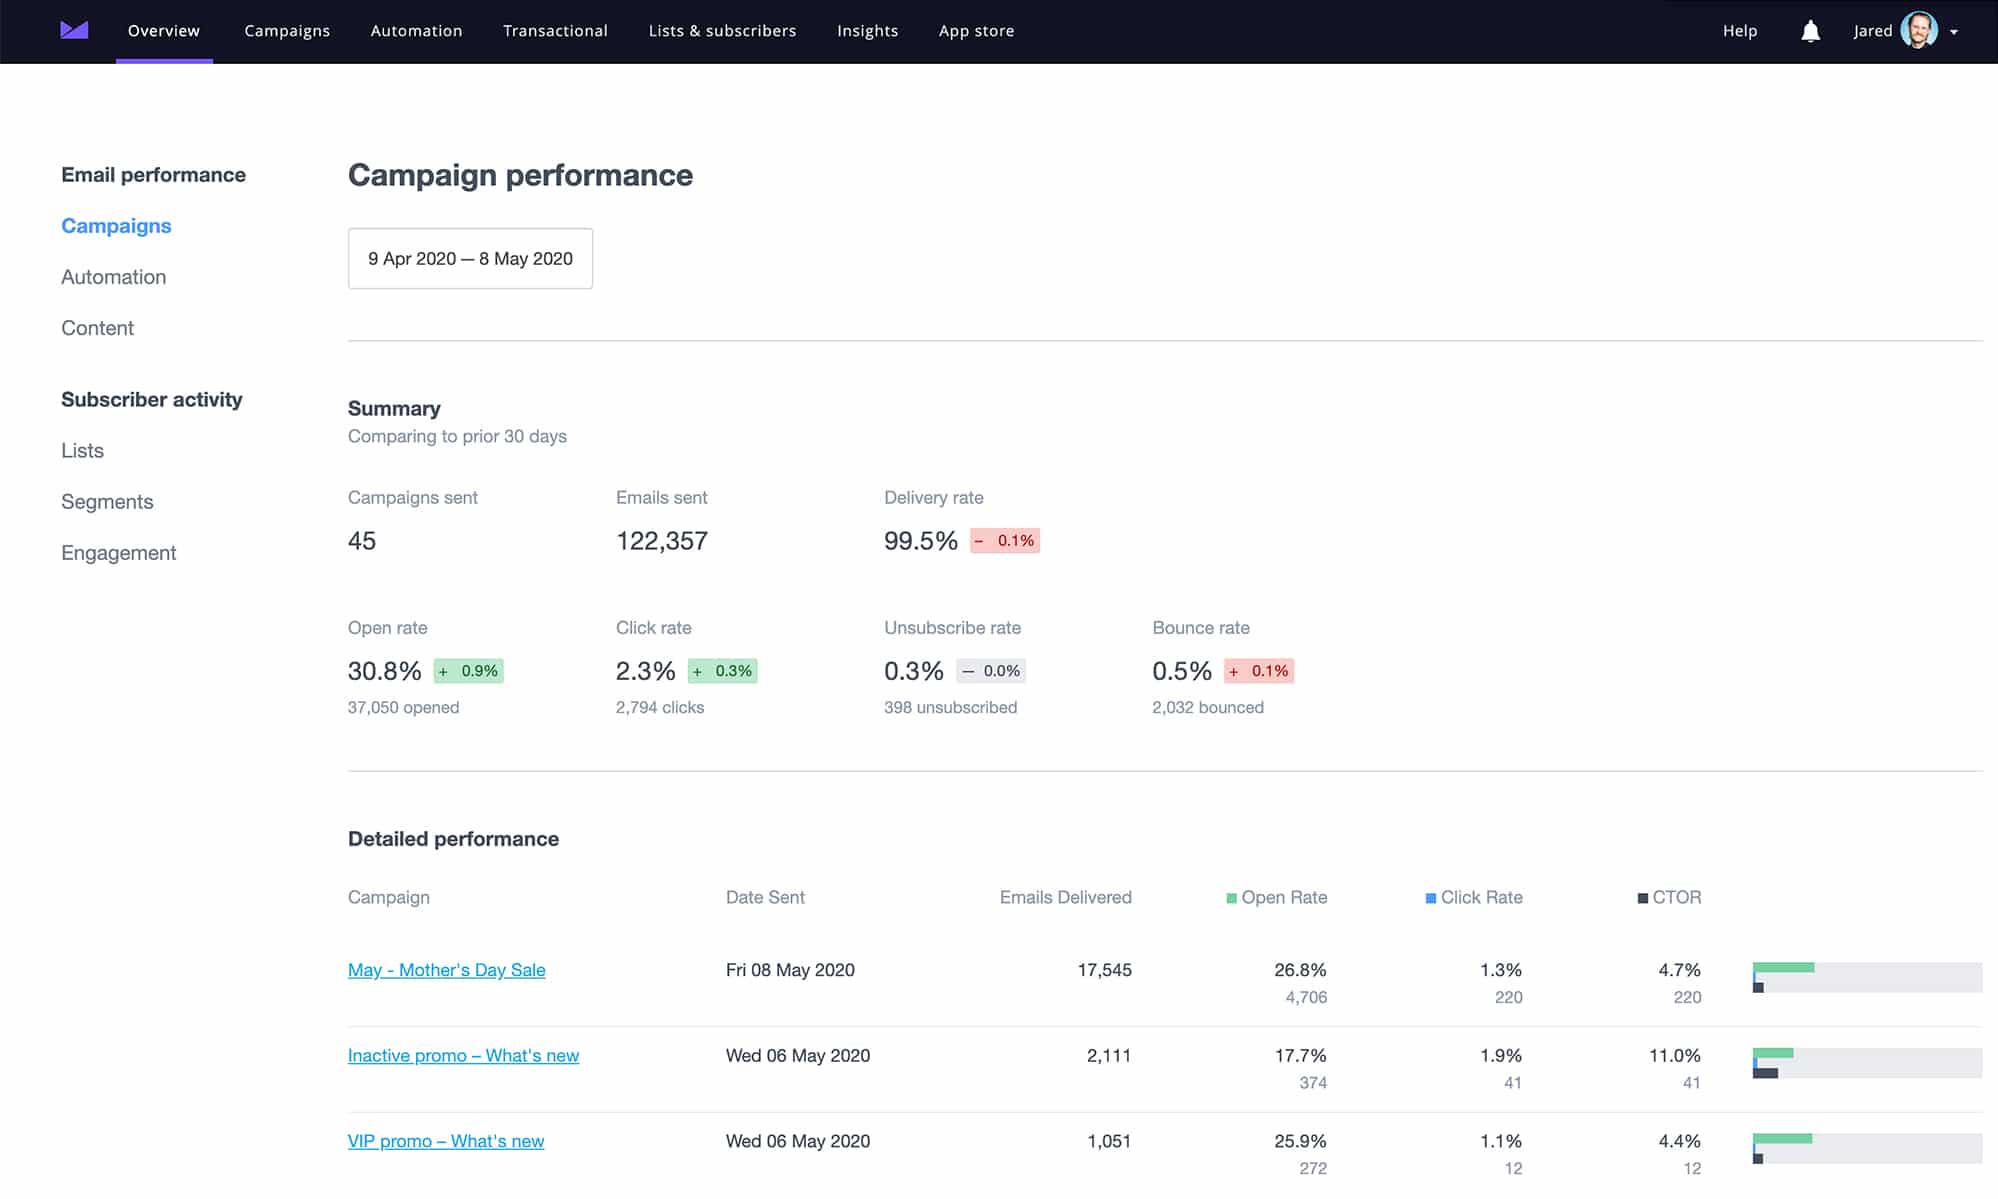
Our analytics dashboard shows what’s driving your email performance—opens, clicks, deliverability, and list health—all in one view.
Enter your email to see how easy data-driven reporting can be.
Turn data into direction: The 3L framework
| Step | What it means | How to apply it in 2026 |
|---|---|---|
| Look Long-Term | Quarterly trends matter more than individual sends. | Monitor engagement and conversion curves to forecast list health early. |
| Link Channels | Email insights inform every other channel. | Sync data with CRM, SMS, and paid retargeting to unify messaging across touchpoints. |
| Leverage Learnings | Turn top-performing insights into repeatable playbooks. | Repurpose your best-performing subject lines, CTAs, and send times across campaigns while letting AI refine timing and audience behavior. |
Sync data with CRM, SMS, and paid retargeting to unify messaging across touchpoints—Campaign Monitor’s advanced automation examples show how to connect them seamlessly.
Data without strategy is noise. Your edge isn’t in having more analytics—it’s in knowing which signals to act on and adapting faster than your competitors. Your content choices can also influence inbox placement—see how in this breakdown of content and deliverability.
Understanding email engagement insights (develop an engagement-first mentality)
The inbox has become an algorithmic battlefield. AI-powered filters in Gmail, Apple, and Outlook now decide what lands in the primary tab, what gets buried in promotions, and what’s ignored entirely.
An engagement-first approach helps you stay visible and credible. Instead of tracking opens in isolation, use insights that measure real interaction:
- Attention metrics: Scroll depth, dwell time, and click patterning show how readers actually consume content.
- Behavior signals: Conversions, forwards, and replies—not just clicks—indicate genuine interest.
- Personalization cadence: Use behavior-based triggers (browsing, inactivity, cart adds) rather than fixed calendar sends.
Modern reporting tools make these metrics easy to spot. Engagement data tells you which content builds trust, which causes fatigue, and when to adjust send frequency to maintain deliverability. Subscribers expect relevance—and engagement is now your strongest deliverability signal.
When engagement dips, learn more about repairing reputation and get back on track.
A healthy audience is a more profitable audience - Measuring audience quality and health
Understanding who is joining your list, how they engage, and when they start to disengage gives you the clearest picture of both quality and health.
When your list is strong, every metric in your reporting dashboard becomes more trustworthy—from engagement trends to ROI attribution.
Track audience quality
Look at how new subscribers behave over their first 90 days:
- Active engagement rate: Aim for 60–70% of subscribers to open or click within the last 90 days.
- Source quality: Identify which channels bring your most valuable subscribers—owned or referral-based signups typically outperform paid traffic over time.
- Progressive profiling: Collect preferences through polls or behavior-triggered emails to personalize without overstepping privacy boundaries.
Monitor list health and deliverability
Even strong lists decay over time. Your reporting tools can help detect early signs of churn before it impacts ROI:
- Bounce rate: Keep under 1.5% to maintain sender reputation.
- Spam complaints: Stay below 0.08%.
- Inactivity threshold: Re-engage or suppress subscribers after 90 days of silence.
Reactivation campaigns perform best when they feel personal—reference the content or products that first drew the subscriber in. If that fails, trimming disengaged contacts keeps deliverability high and data clean.
Bluetent increased client revenue by $50K and achieved 75% open rates with Campaign Monitor
Revenue increase from integrated email campaigns
Open rate for web subscriptions
Growth in new subscribers
Campaign Monitor is extremely innovative and perfectly aligned with our goals. It gives us both ready-made templates and the freedom to code our own — fully integrated with our reservation data.
Insights and KPIs you need to track
Understanding your email performance is about more than counting opens and clicks. To make data meaningful, measure through two key lenses: email performance and subscriber activity.
Together, they show how well your campaigns perform and how your audience engages over time.
For a deeper breakdown of each metric—including formulas and benchmarks—see our full email marketing KPIs guide.
Email performance
Email performance covers the classic metrics marketers track to benchmark campaign success—such as open rate, click-through rate, bounces, and unsubscribes. These KPIs reveal how your messages are received and what opportunities exist for improvement.
Evaluate your campaign performance
Let’s look at a short explanation of what each metric is and how it measures the performance of your campaigns.

Start by tracking these essential metrics to understand where your campaigns shine and where you can optimize.
Campaign open rate

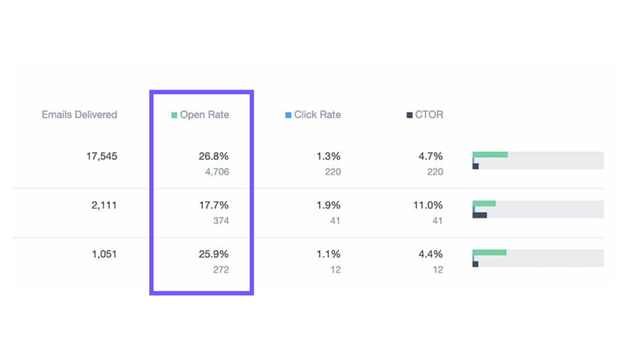
Open rates vary largely, depending on the size of your list, method of collecting email addresses, and a host of other factors, but, generally speaking, a healthy open rate is in the 20%-40% range. If your open rates are above that, then your campaigns are well optimized. If they’re below that range, there’s likely some opportunity for improvement.
Campaign click rate
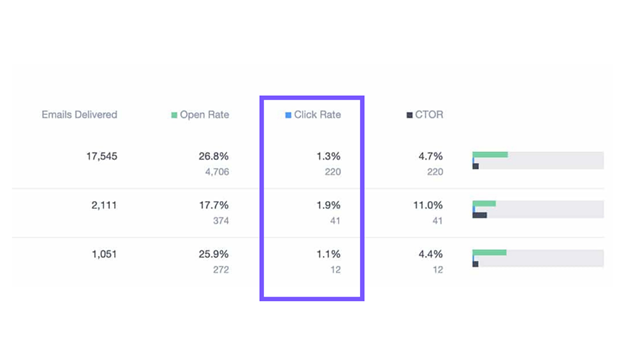
Your click-through rate can vary, depending on the size of your list, the content of your email, and a host of other factors, but, generally, a healthy email click-through rate is in 15% range.
Your CTR is usually an indication of how valuable the content of your email is to your audience, as well as the call to action associated with it.
Low CTRs suggest your message or offer may need clearer CTAs or better alignment with subscriber needs.
Click-to-open rate
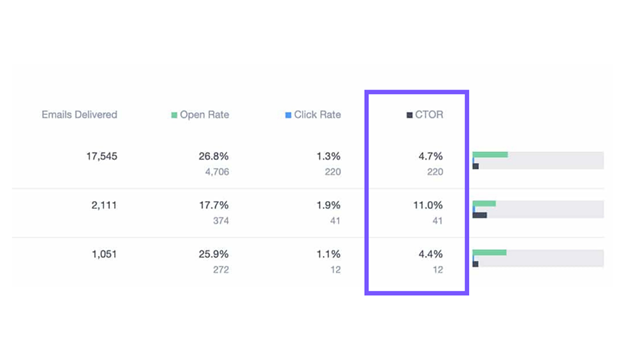
Click-to-open rate, or CTOR, is determined by taking the unique clicks divided by unique opens, and is then expressed as a percentage. It tells you the percentage of recipients who opened the email, how many clicked, and is a leading indicator of the value of the content that you’re sending.
Unsubscribe rates
By evaluating unsubscribe rates, you can quickly see if the content that you’re sending and the frequency of your communications are valuable to your audience. Unsubscribe rates less than 2% are within industry norms.
Check your deliverability trends
Deliverability benchmarks vary by industry, so tracking delivery rates over time is key. Delivery rate is calculated by subtracting bounces from total sends. If delivery is dropping, investigate issues like sender reputation, content flags, or spam triggers.
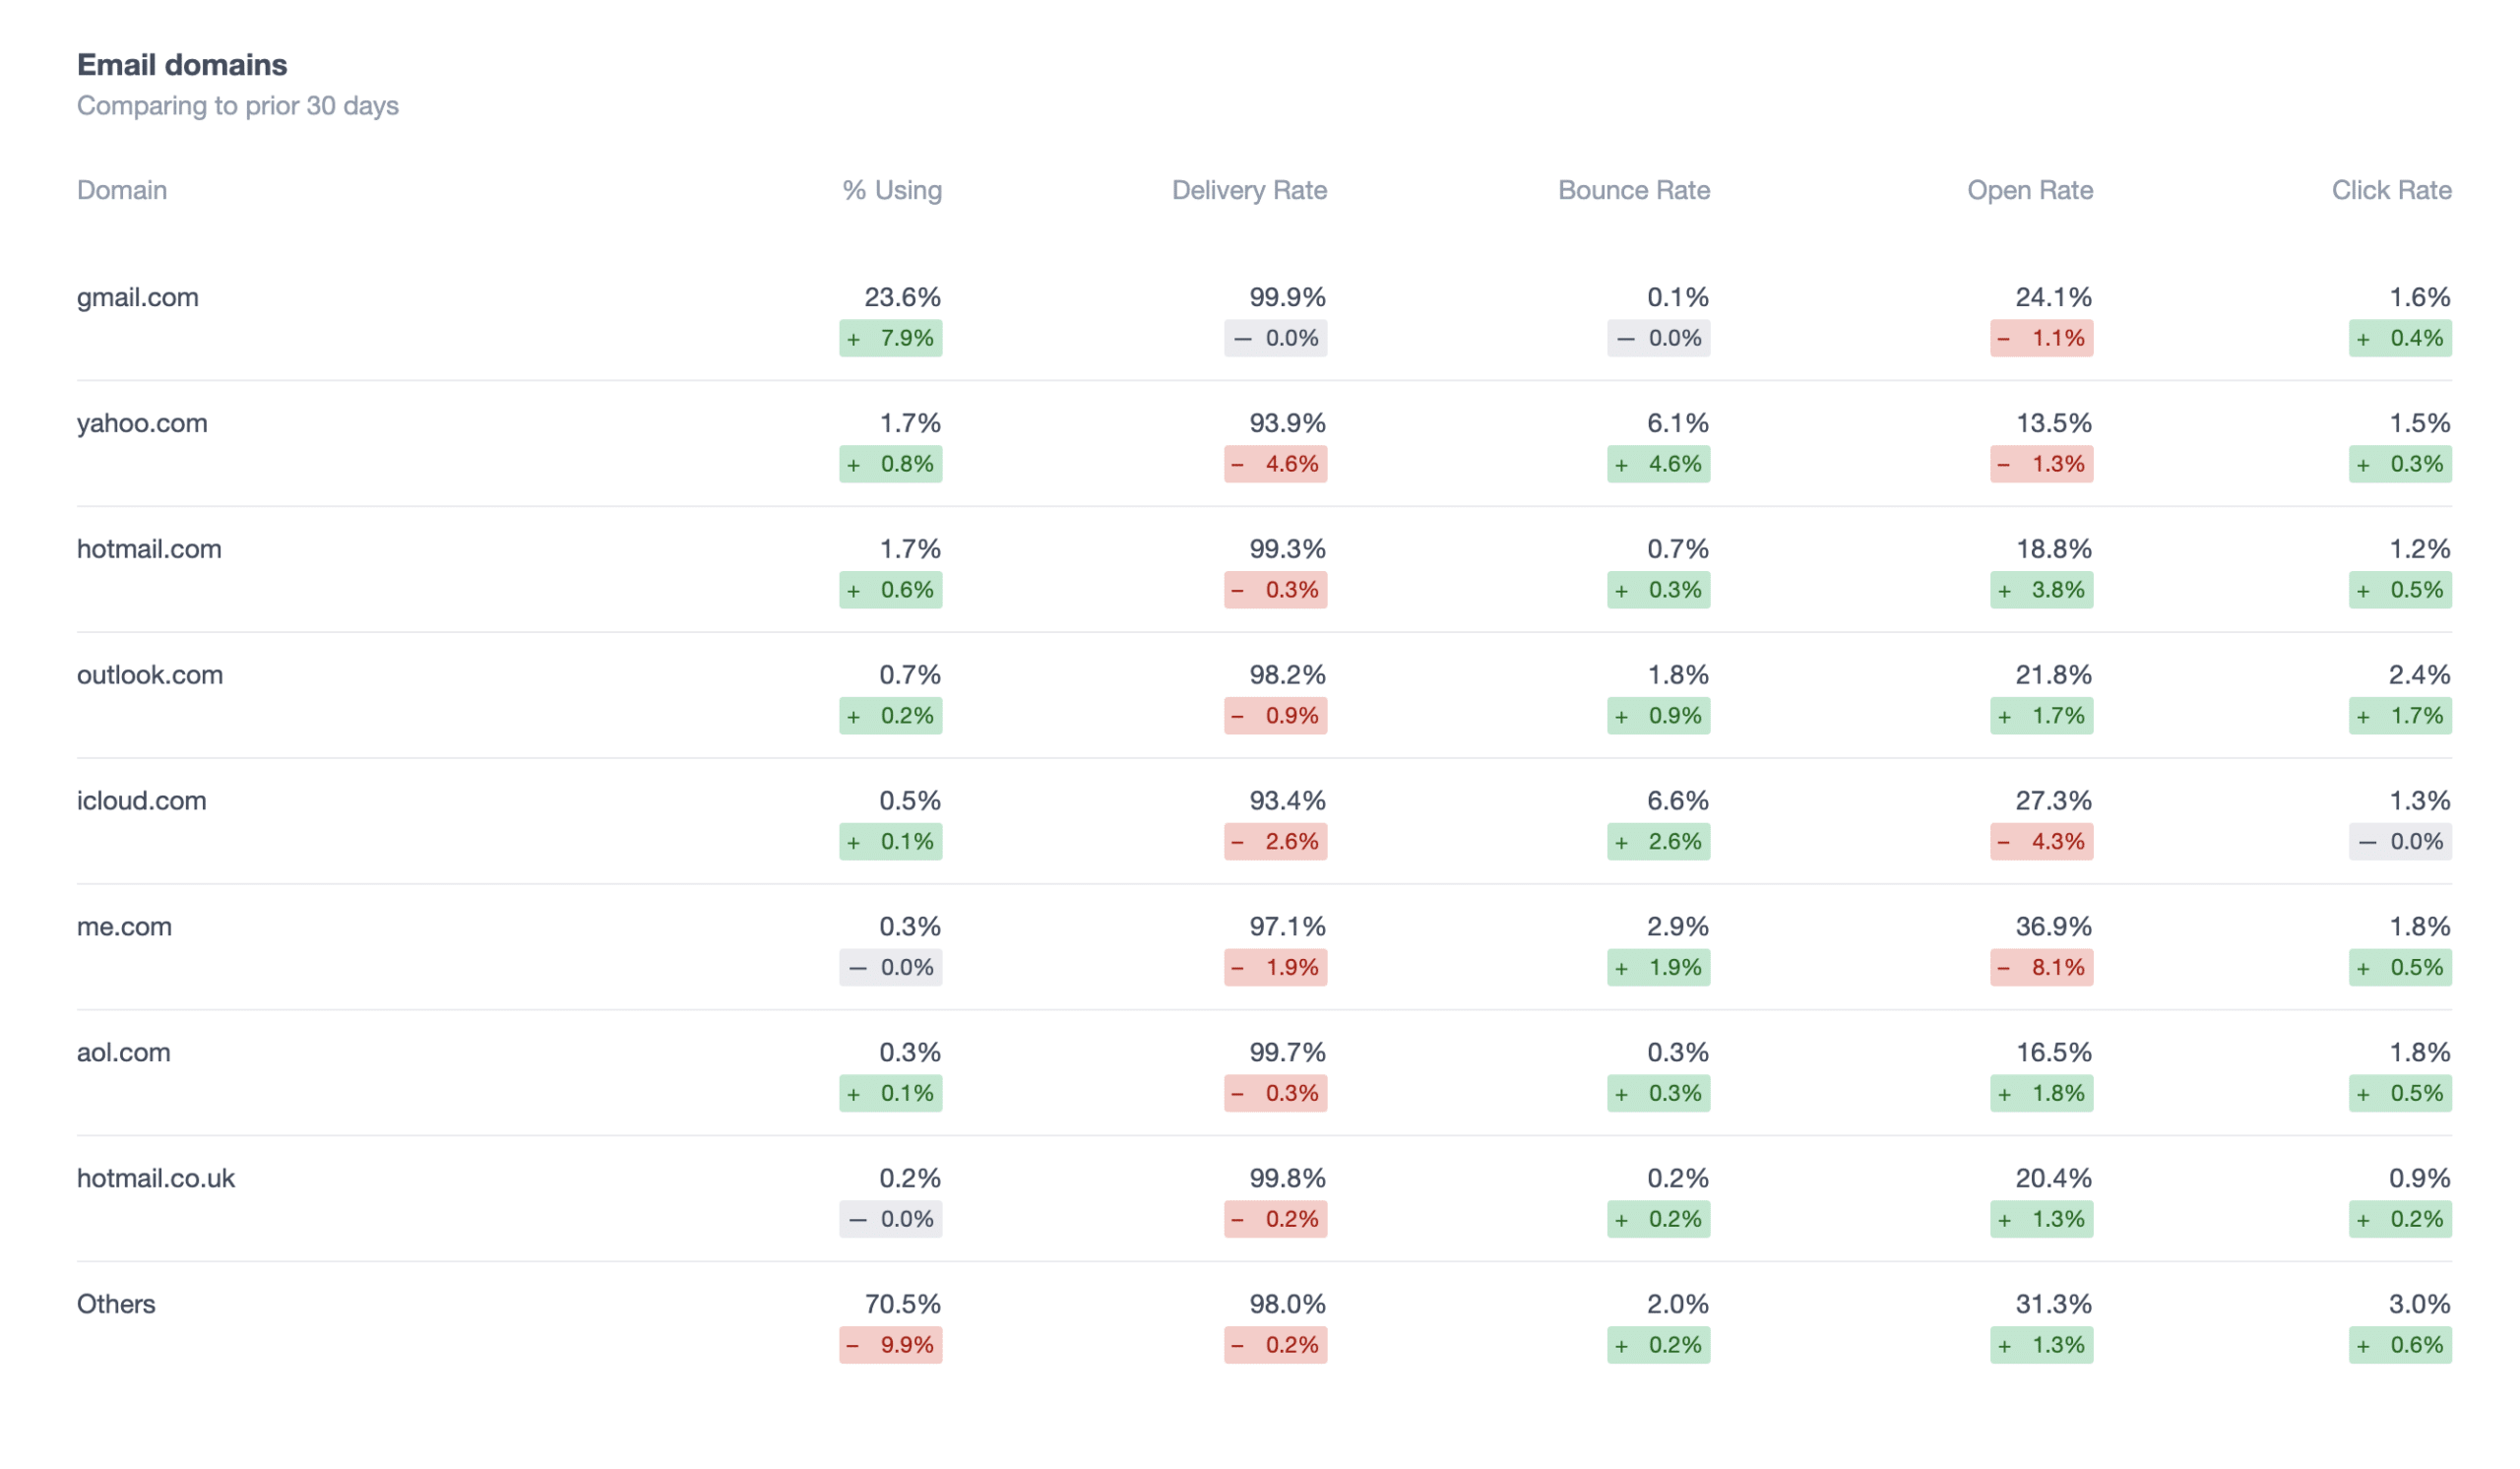
You can also review performance by domain (e.g., Gmail, Yahoo) to see if specific inbox providers view your reputation differently.
The delivery rates are calculated by summing up all of the emails sent and subtracting out the bounces. If your deliverability rates are low, you may be unintentionally doing one of these nine things.
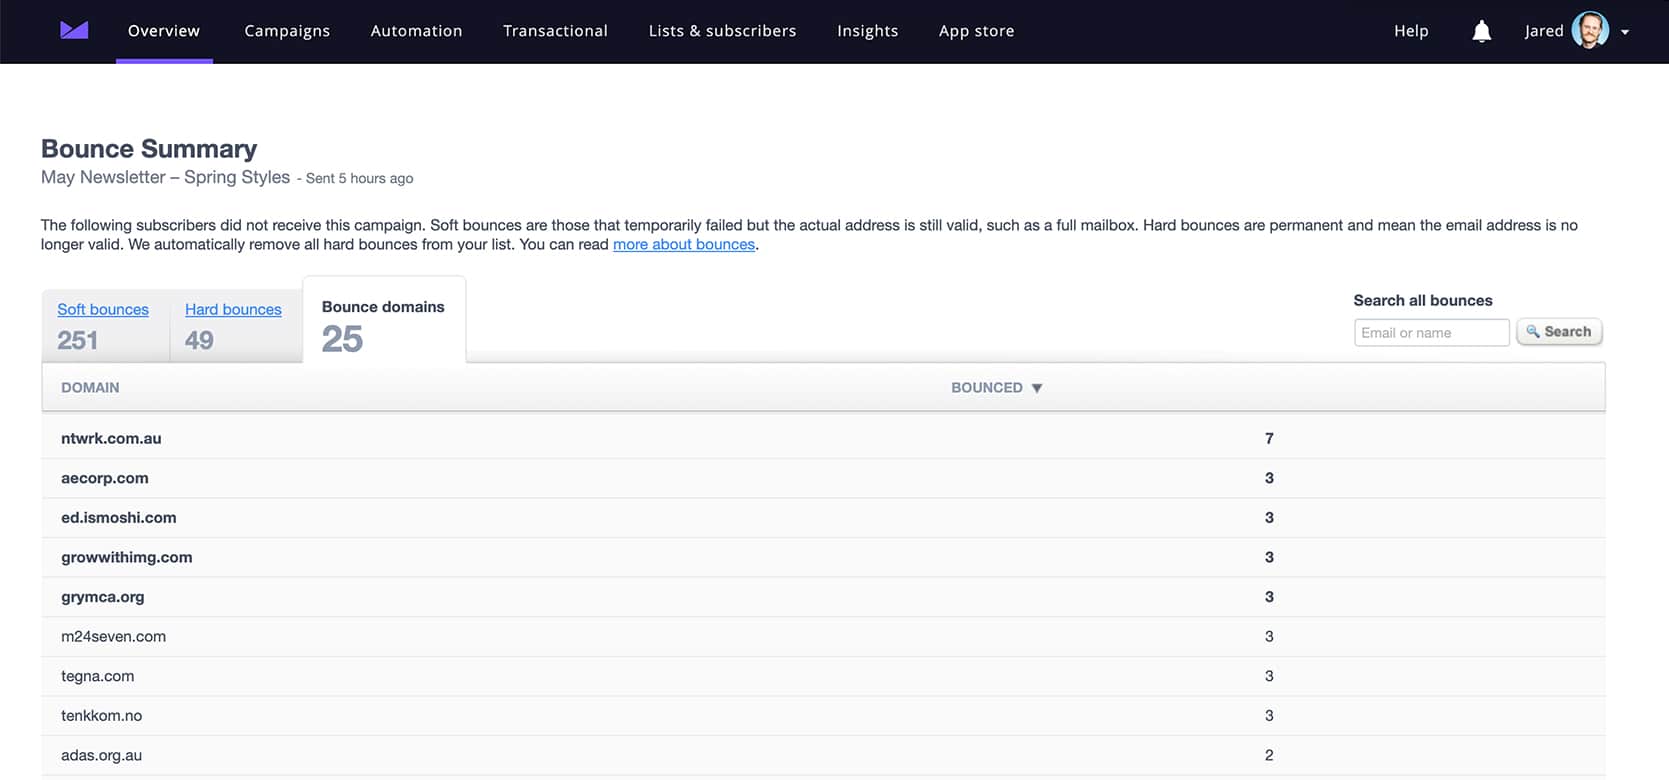
Check individual campaign-level data to troubleshoot issues quickly.

Keep your sender reputation strong. Campaign Monitor tracks deliverability by domain so you can spot issues early and maintain high inbox placement.
Try it now and monitor deliverability with confidence.
It’s also helpful to troubleshoot deliverability with specific domains by evaluating at the campaign level if you notice a spike in bounces on a particular send.
Pro Tip: Maintain list hygiene, avoid spammy phrasing, and send from authenticated domains (SPF, DKIM, DMARC) to improve deliverability.

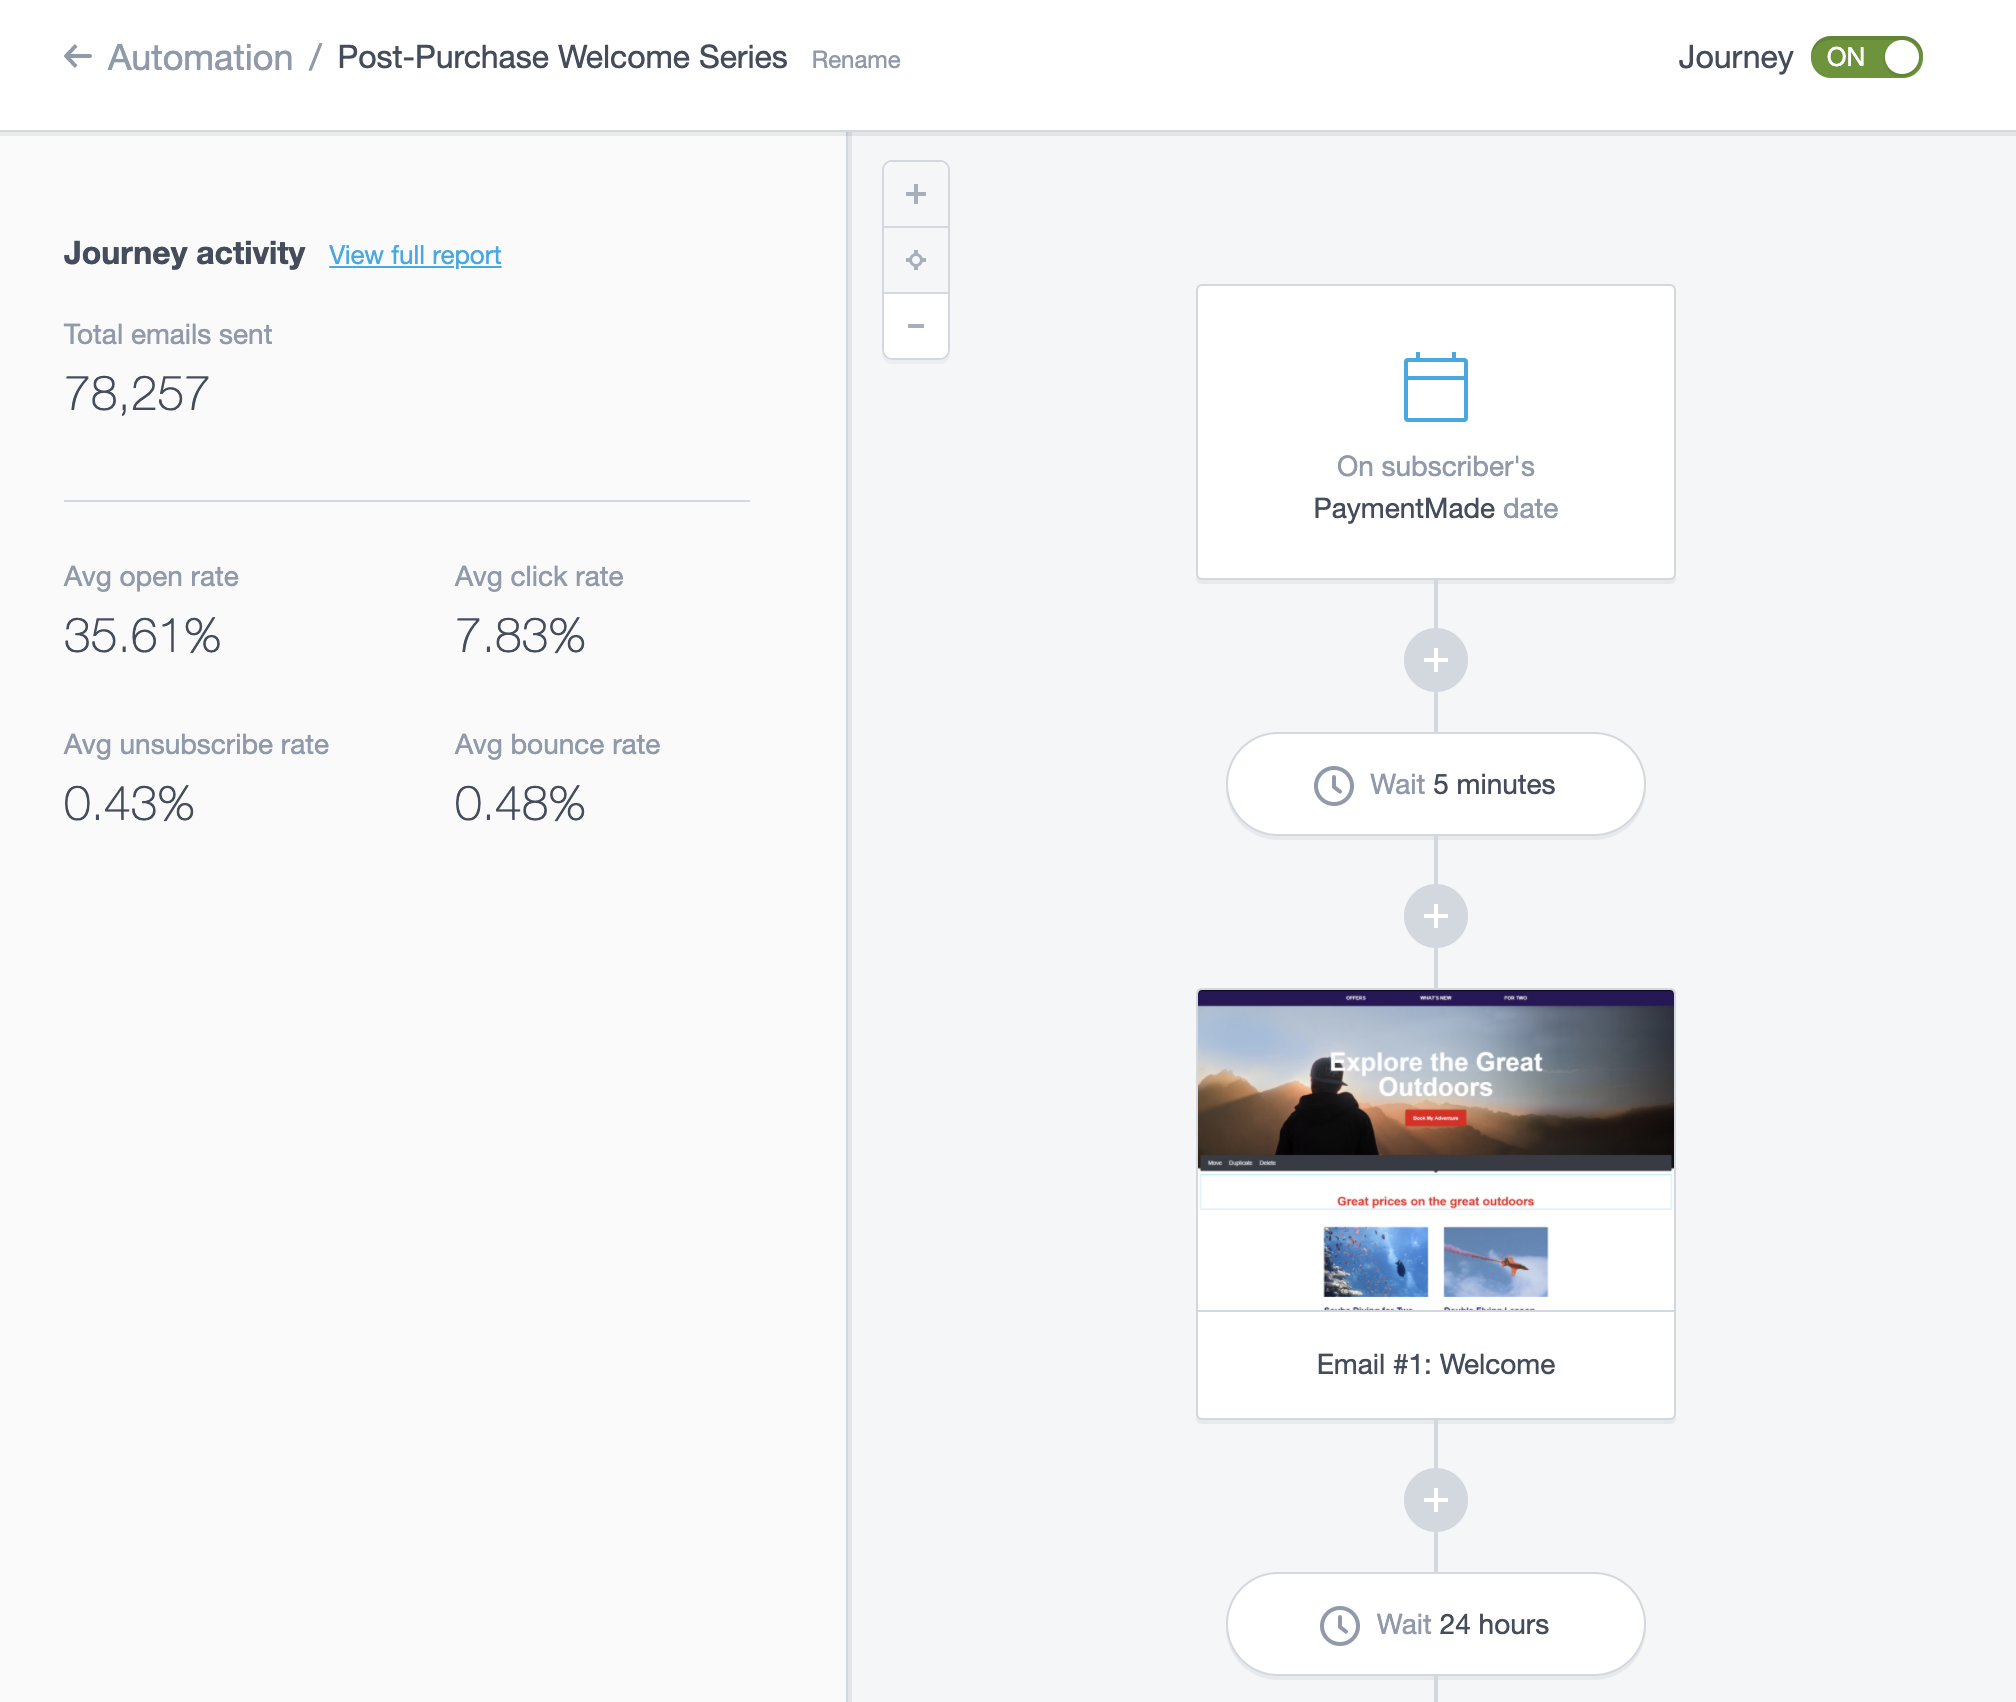
Evaluate journey performance
Automations and journeys deserve the same attention as one-off campaigns.
Review how many subscribers enter each automation and how their behavior changes over time:
- Are subscribers completing your onboarding flow?
- Which journeys drive the highest engagement or conversions?
- Are reactivation or re-engagement journeys performing well?

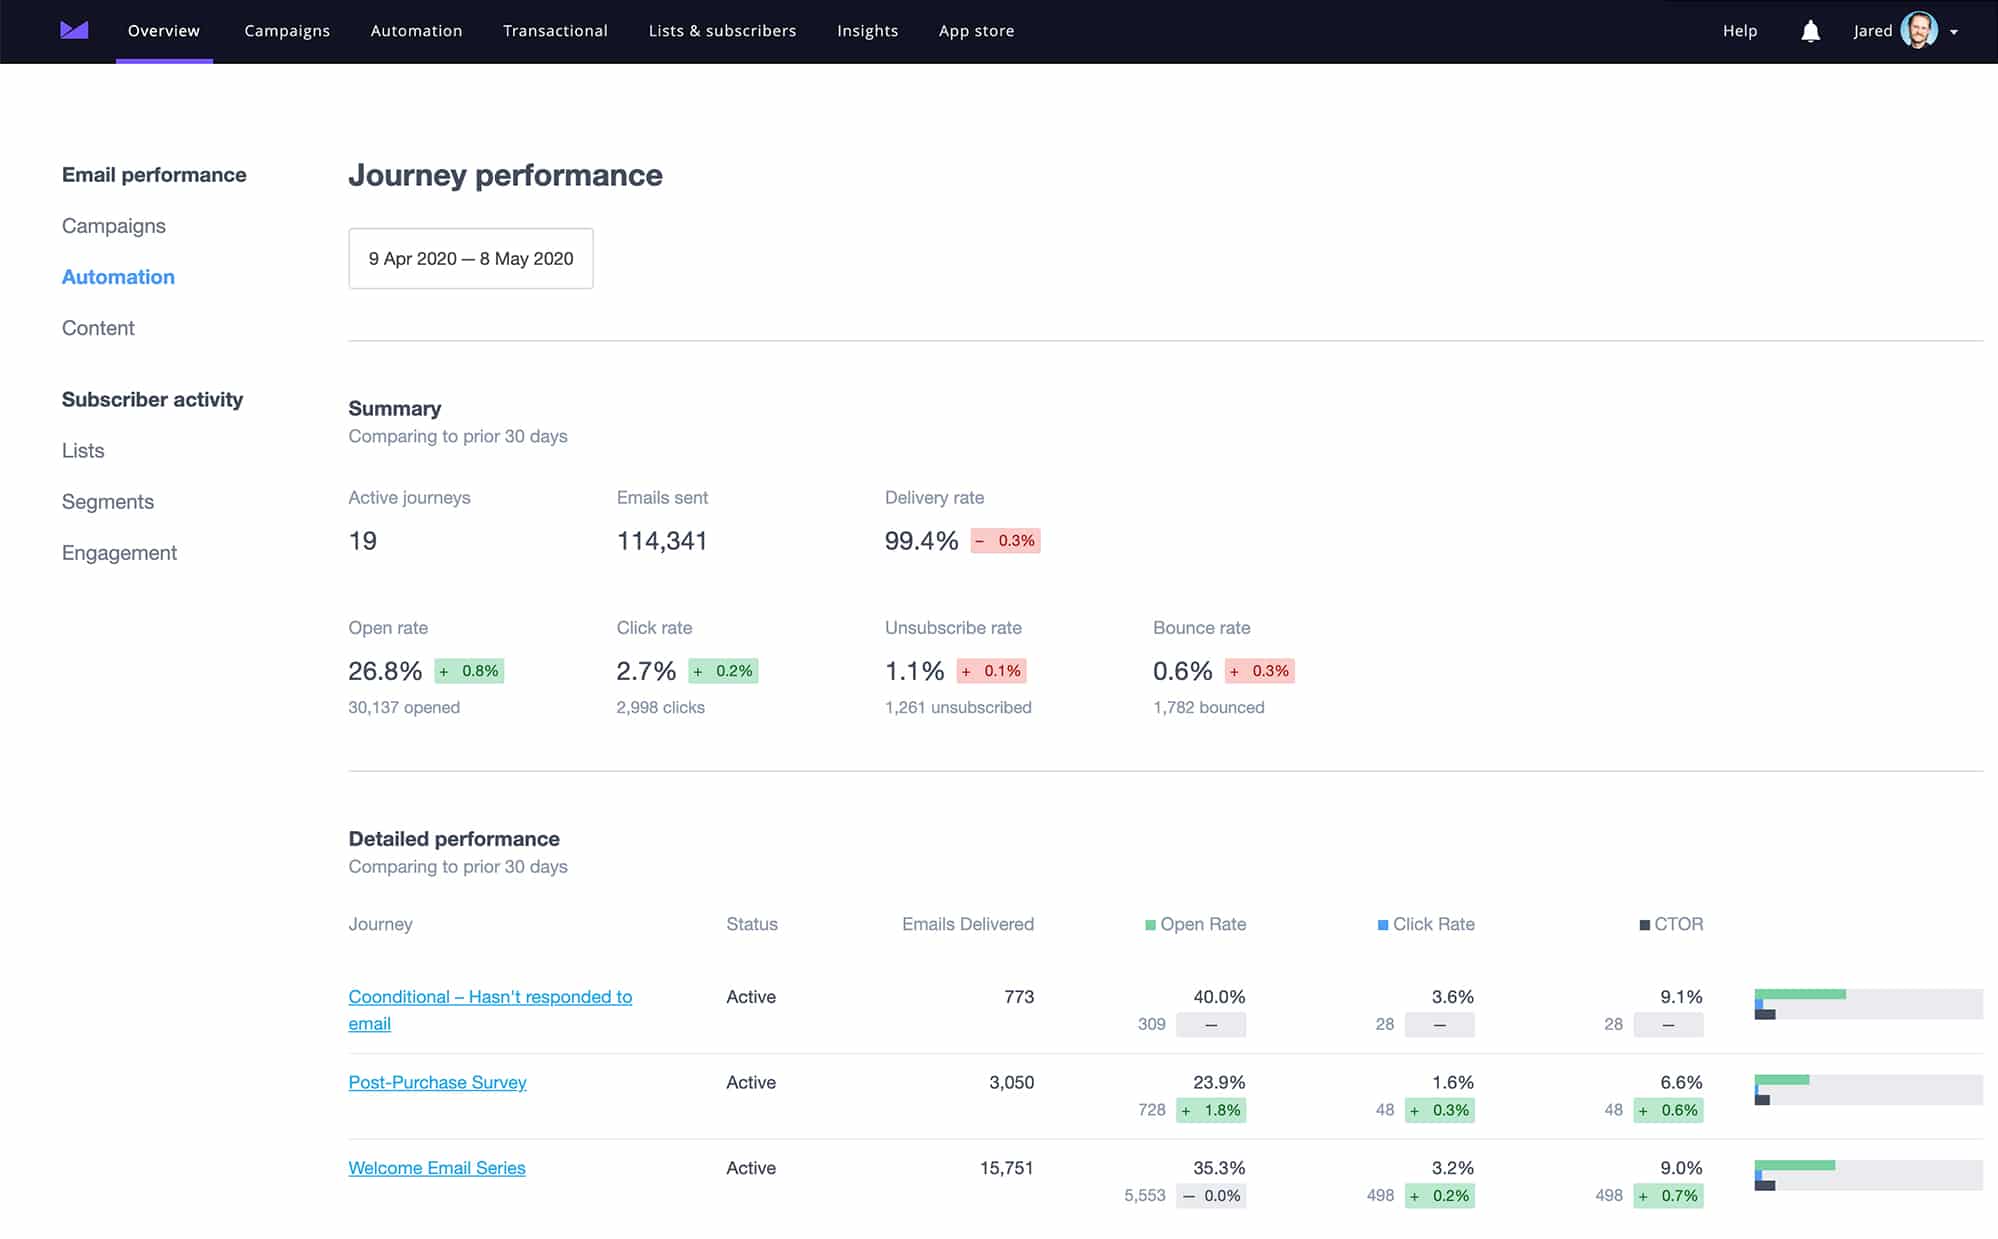
Check these metrics regularly and adjust triggers or messaging to keep journeys relevant and efficient.

Content performance

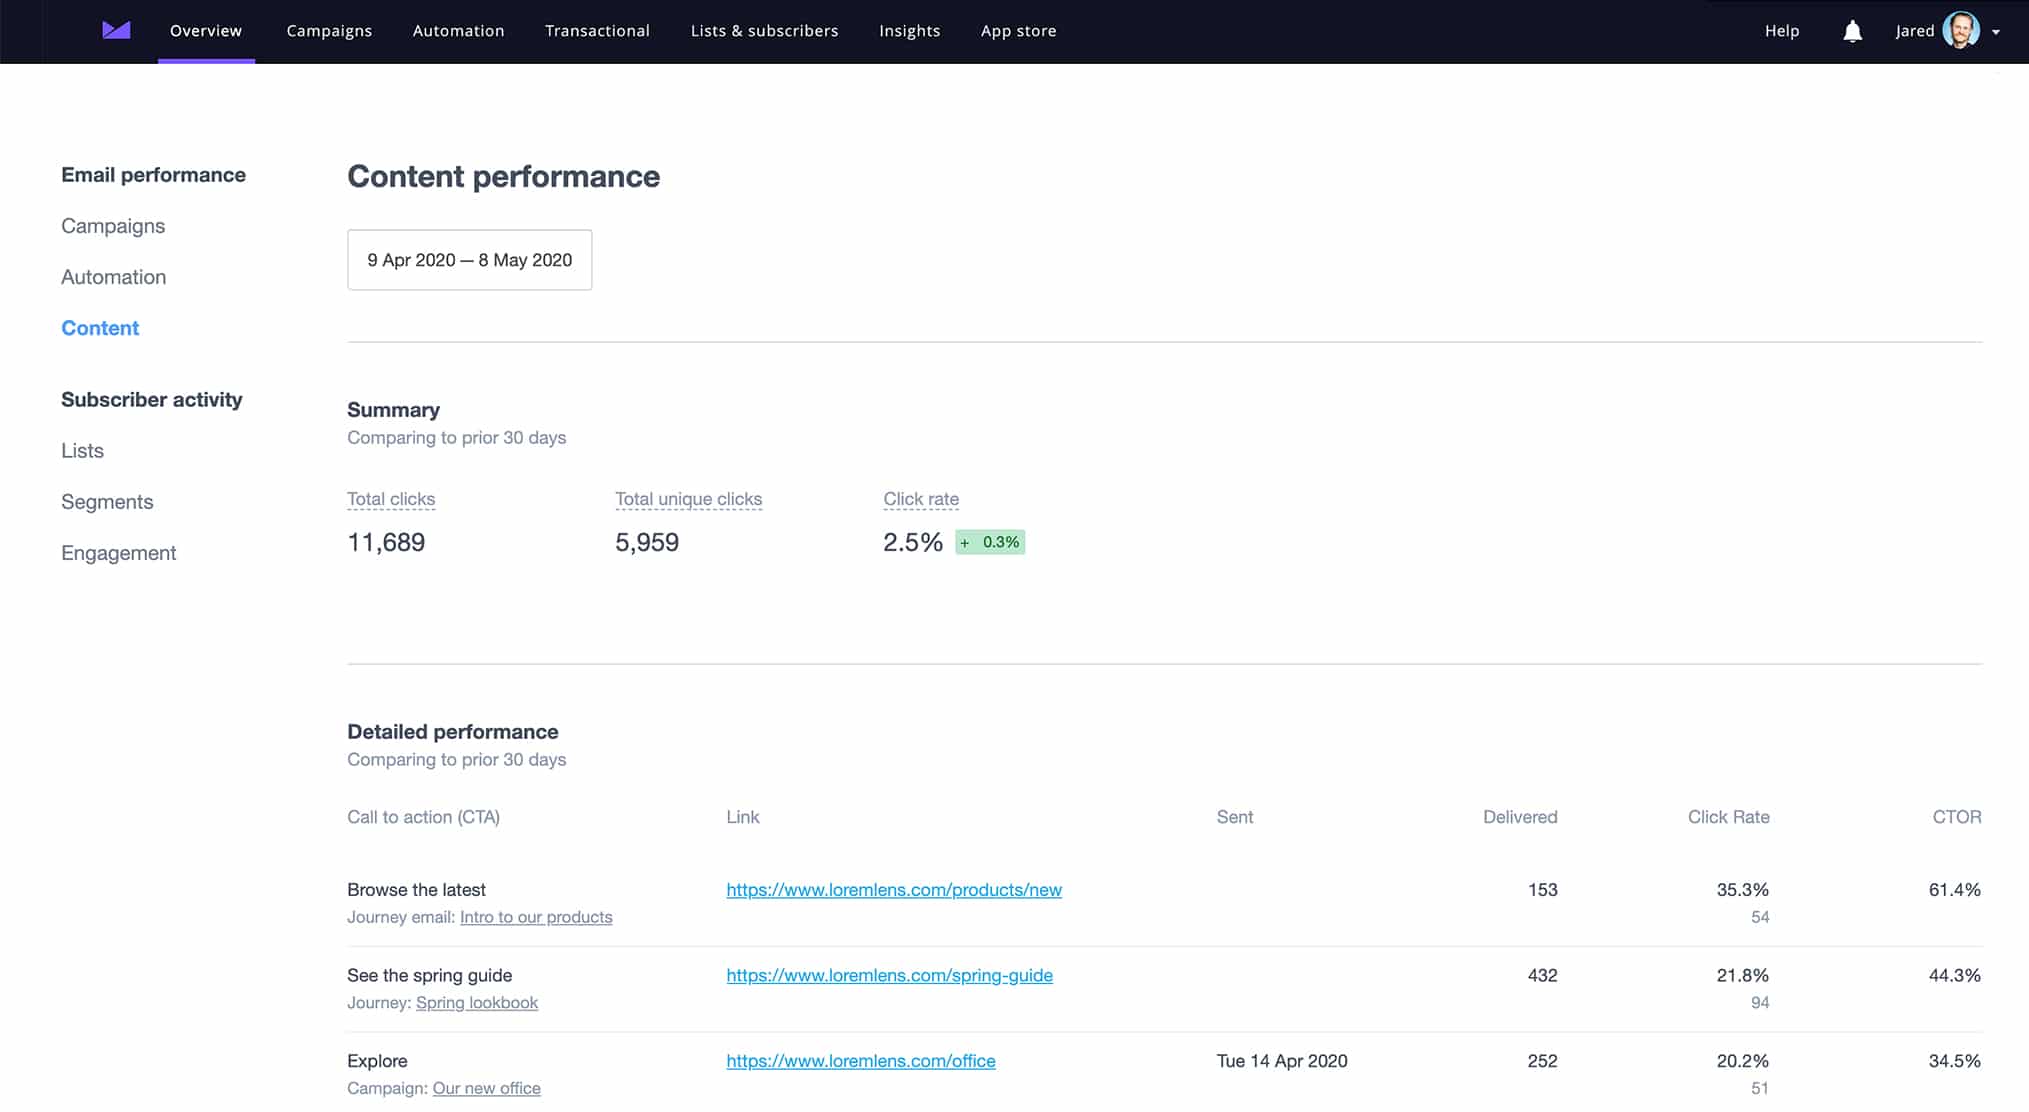
If you send multiple pieces of content in your newsletters or include multiple links, then understanding exactly which links subscribers are clicking can help you improve the way you format CTAs and structure your campaigns.
Use content performance reports to identify:
- Which CTAs or links attract the most engagement
- Where subscribers stop scrolling or lose interest
- What topics consistently drive the highest CTOR
Insights like these help you restructure emails for clarity, improve call-to-action placement, and increase overall campaign engagement.
Our Content dashboard can help with this. These reports provide a detailed view into which links and CTAs are driving the most engagement in every campaign.
Discover which links and CTAs drive the most clicks using our A/B testing tool
Test, compare, and refine your content to boost conversions with every send.
Subscriber activity

Subscriber activity is all about understanding the behavior of your audience and the health of your subscriber base.
Monitor audience health
Detailed analytics reveal which acquisition sources bring your most engaged subscribers and how engagement levels shift over time. This helps you create a plan for developing a highly effective and profitable email marketing strategy.
List growth over time
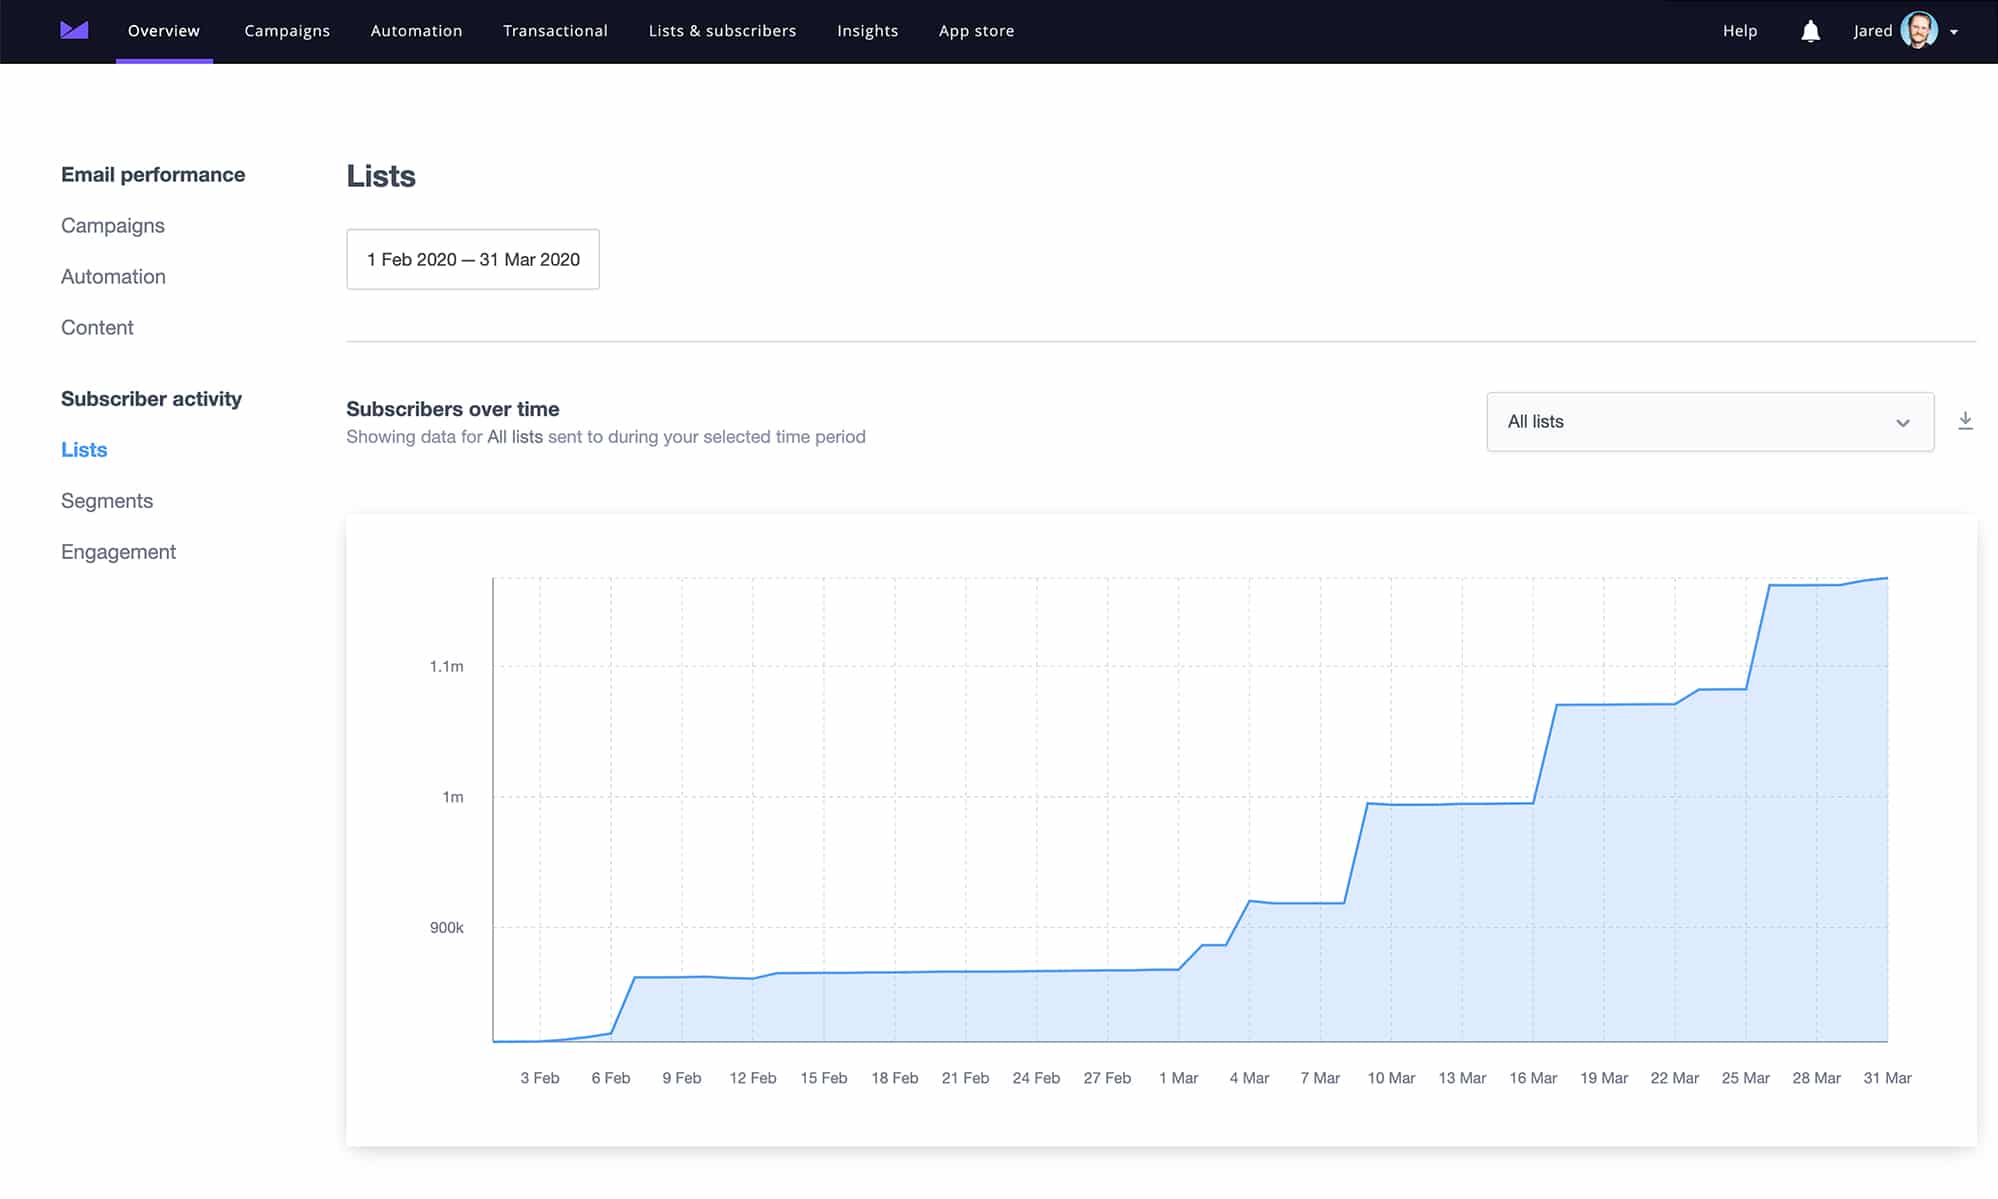
A steadily growing list signals that your brand and content remain relevant. If growth stalls, your value proposition or opt-in strategy may need review.
Keep an eye on the following:
- Monthly net growth rate (new subs minus unsubscribes)
- Conversion rates on signup forms and landing pages
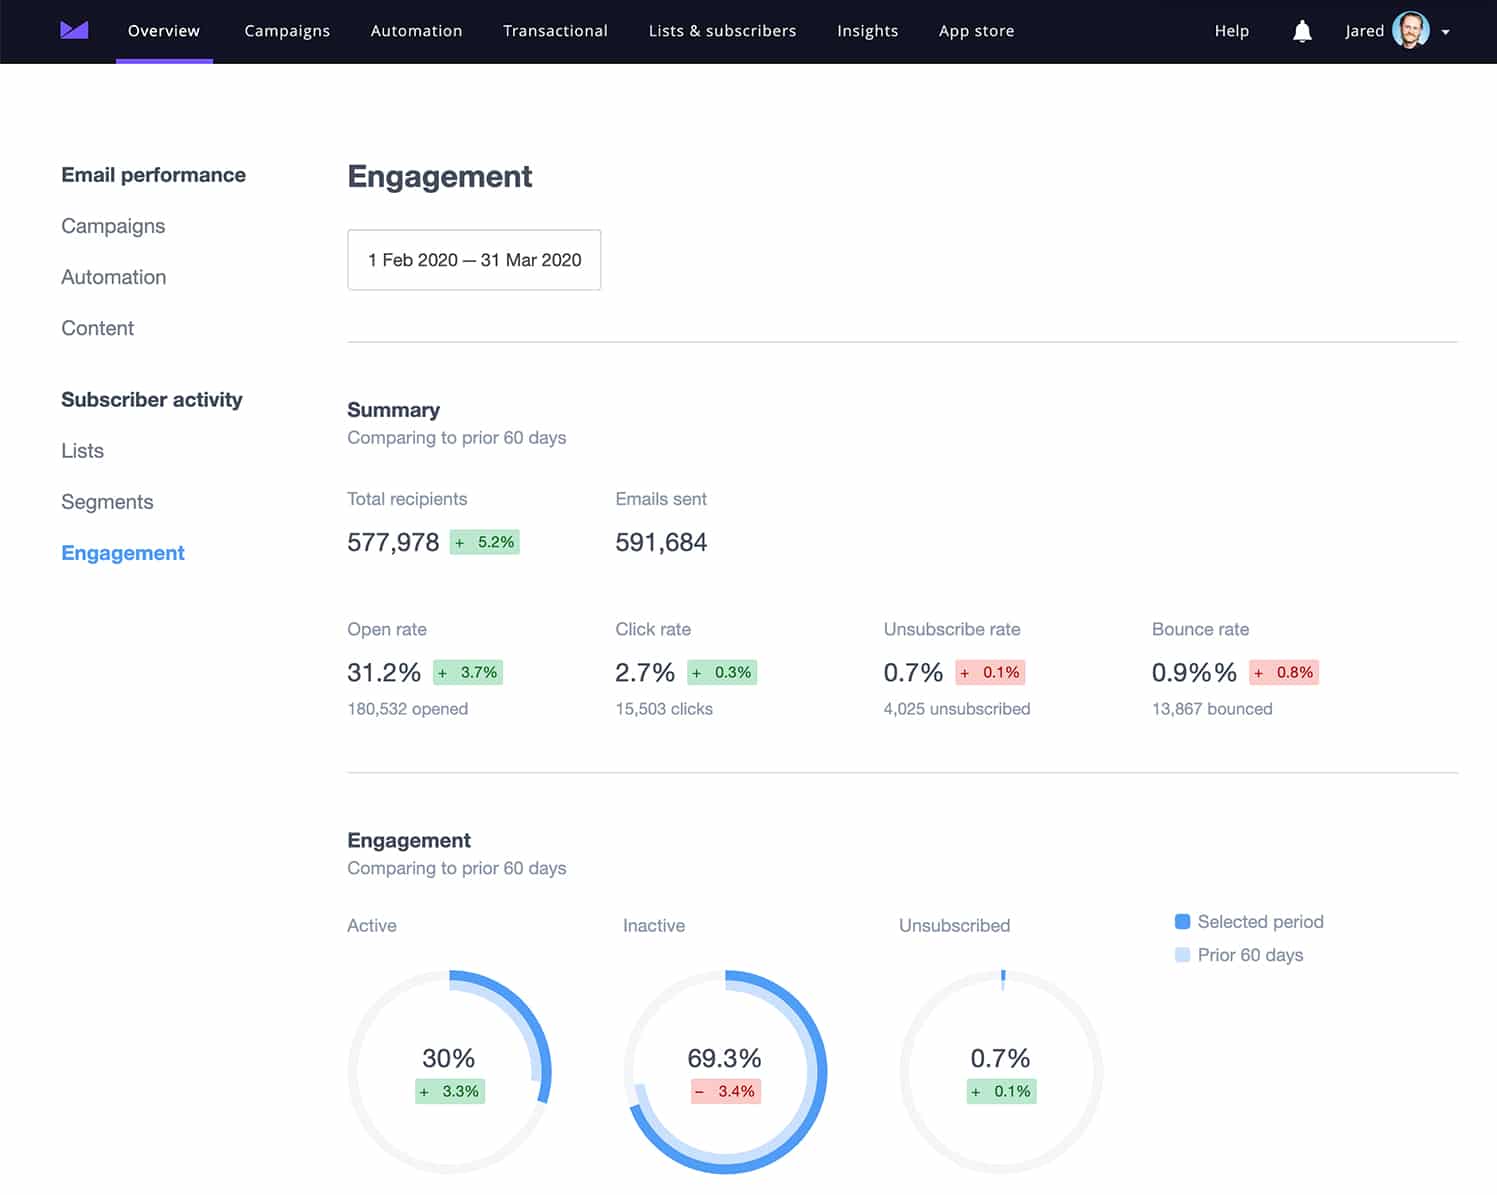
Active subscriber comparison

Understanding the ratio of active vs. disengaged subscribers helps maintain a healthy engagement balance.
Your engagement dashboard should show:
- Percentage of active, inactive, and unsubscribed users
- Red flags like rising inactivity or unsubscribes
- Opportunities to scale winning content for your most engaged groups
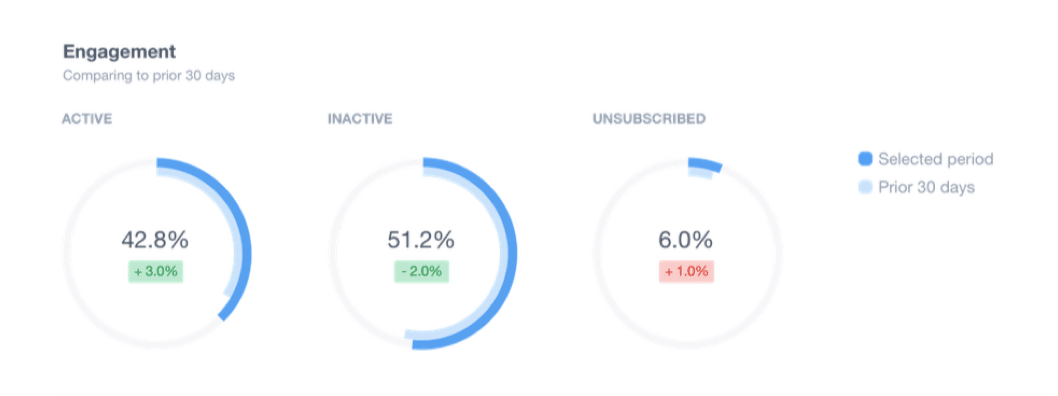
Engaged vs. inactive subscribers

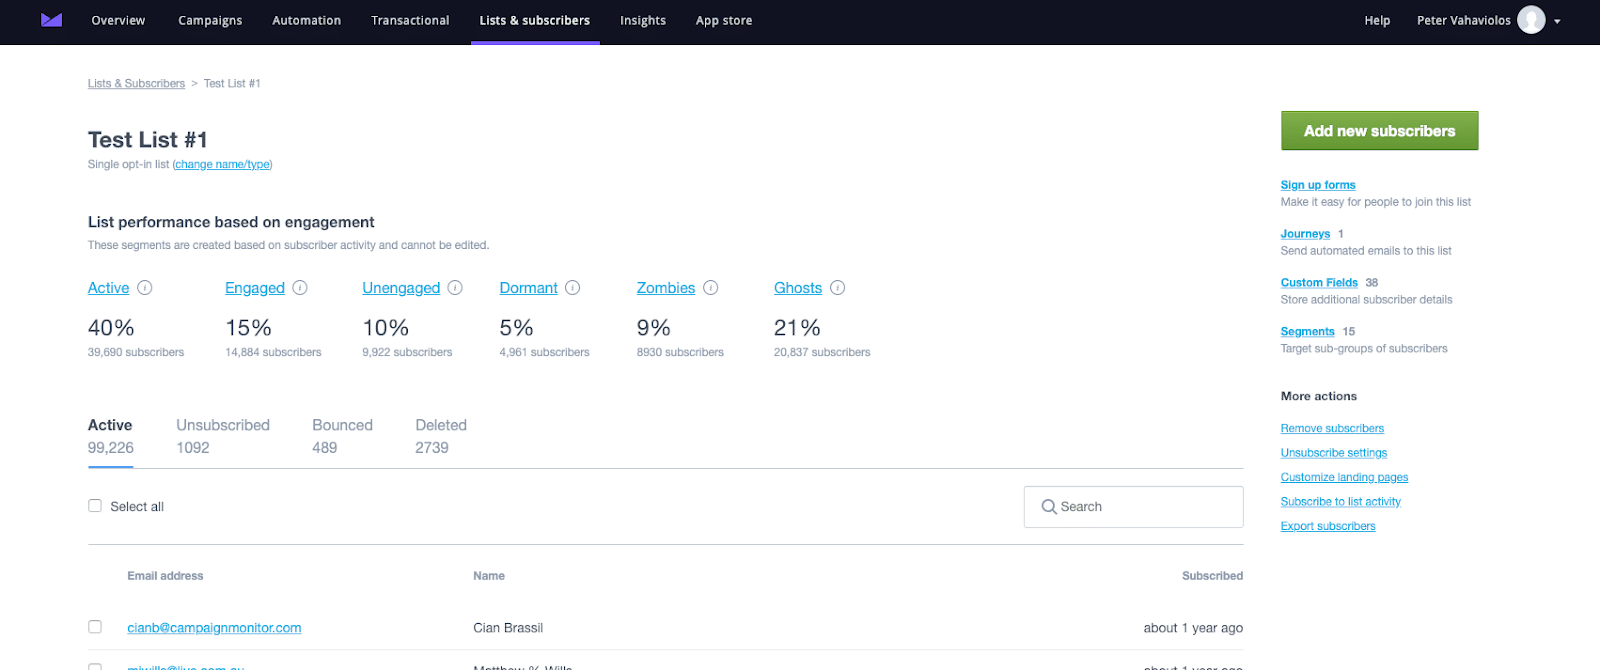
Developing a healthy level of engagement with your audience is more important than sheer subscriber growth. Use pre-built segments to track highly active vs. dormant users:
- Re-engage inactive subscribers with fresh incentives or tailored content.
- Activate top performers through VIP rewards or exclusive campaigns.
Track how subscribers are viewing your emails.
There are more devices and more email clients than ever before, and, to ensure your campaigns look great wherever your audience is opening them, you need to know what devices and clients they’re using.
Engagement by client or platform
Engagement by platform provides a breakdown of the platforms your subscribers are using to engage with your campaigns.
Using the click-rate trends as a proxy for engagement, you can then optimize your campaigns to suit the environments they are being read in.

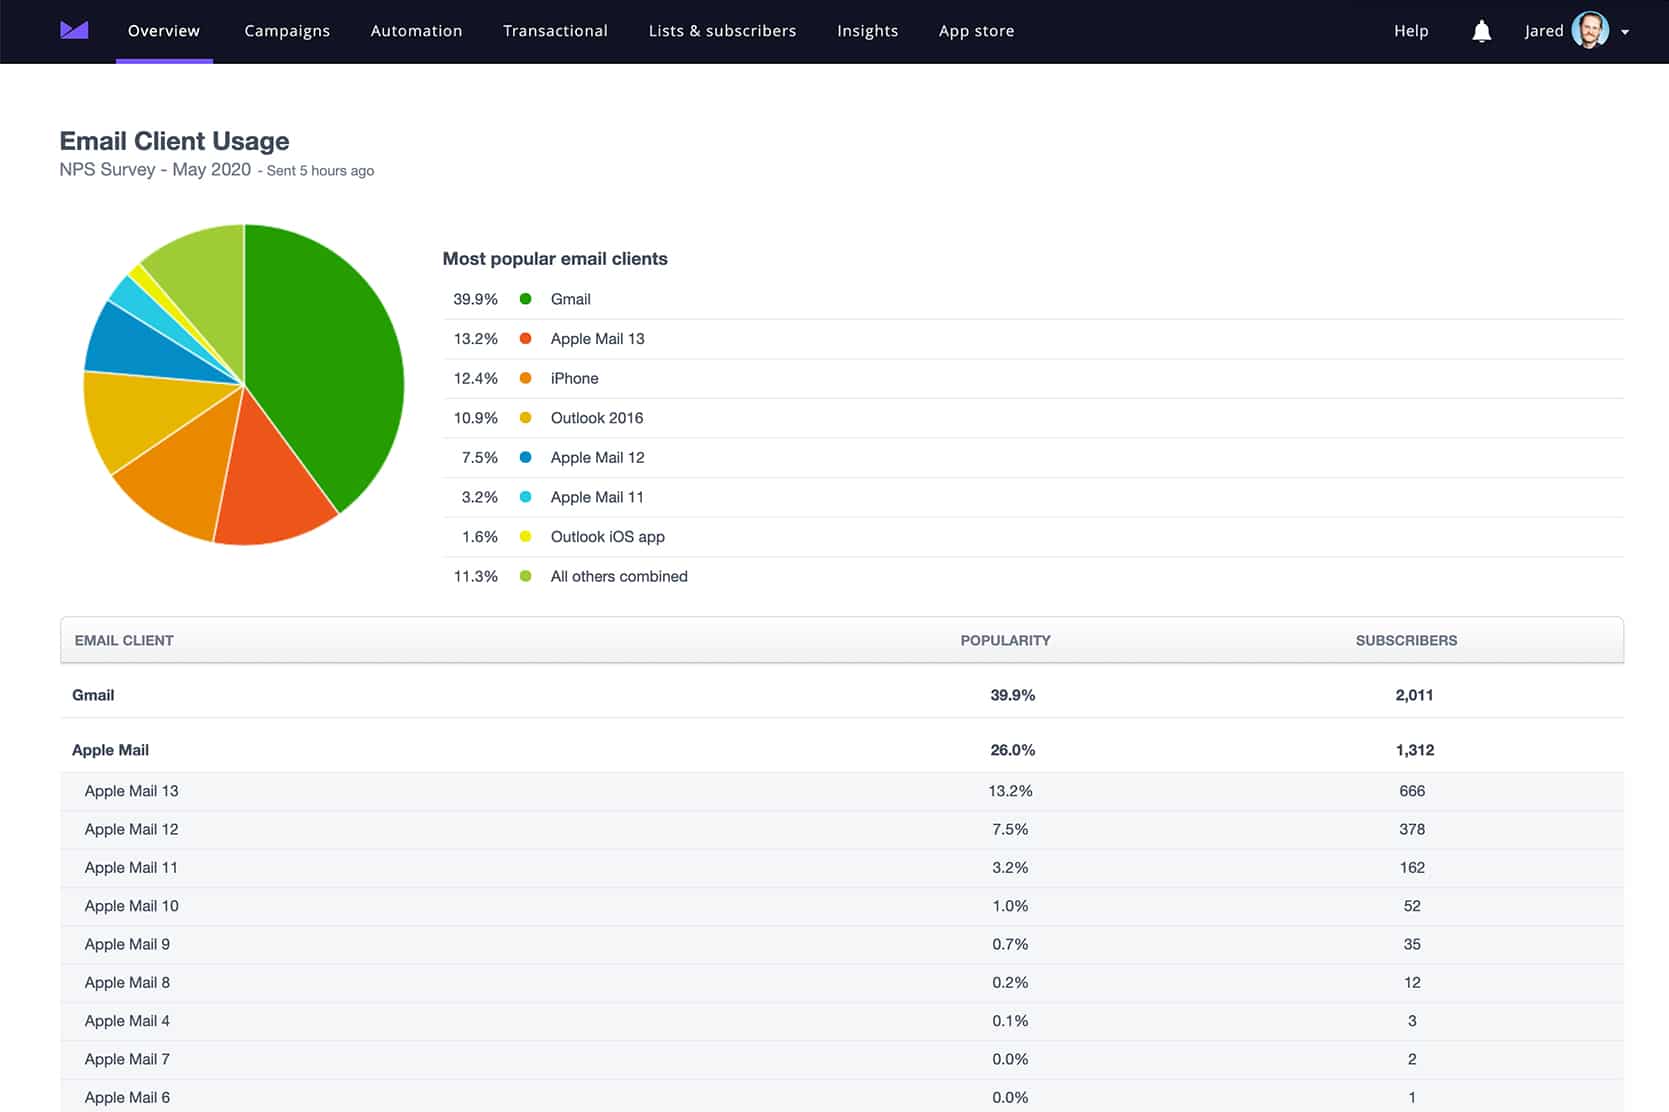
For instance, if you see a lot of your subscribers are reading your campaigns on Outlook iOS, then it might be worth optimizing your campaigns for mobile by applying some mobile email best practices.
Engagement by email domain
Engagement by email client provides you the insight about what email clients your subscribers are using to read your emails.
Not all email clients render emails the same. And, if, for instance, you have a large part of your subscriber base using Outlook, you may use different design tactics than if the vast majority of your list uses Gmail.
Case Study: Switchback Email Marketing boosted client booking revenue by 55% using Campaign Monitor
Increase in booking revenue through automations
Open-rate lift among inactive audiences (first month)
Customizable email programs built on Campaign Monitor
Campaign Monitor has allowed us to craft specific solutions for the vacation rental industry that are unique not only to Switchback but also to our clients’ strategies.
Building a Sustainable Email Reporting Routine
The most successful marketers don’t treat reporting as an afterthought—they treat it as an operating system. Use this simple cadence to turn your analytics into a repeatable, scalable process.
| Frequency | Focus Area | What to Review | Key Actions | Schedule |
|---|---|---|---|---|
| Weekly — Campaign Performance Check | Engagement & Deliverability | – Opens, clicks, unsubscribes, bounces – Deliverability by mailbox provider (Gmail, Outlook, Apple Mail) – Subject line and CTA performance |
– Identify quick optimizations for timing, segmentation, or creative – Apply insights to upcoming sends |
|
| Monthly — Trend & Audience Analysis | Engagement Trends & List Growth | – Engagement rate trends – Active vs. inactive subscriber ratio – Source quality and revenue per campaign |
– Spot improvement areas – Re-run A/B tests based on new learnings |
|
| Quarterly — List Health & Automation Review | List Maintenance & Automation | – Inactive subscriber percentage (90-day benchmark) – Deliverability metrics (bounce <1.5%, complaints <0.08%) – Automation and content relevance |
– Re-engage or remove dormant subscribers – Refresh templates and recalibrate KPIs |
|
| Yearly — Strategic Performance Audit | ROI & Planning | – Year-over-year engagement and list growth – Attribution and revenue impact – Benchmark comparison vs. industry |
– Set performance goals and budget priorities for the coming year – Identify automation or creative investments |
Make It Easy to Maintain
You don’t need complex spreadsheets to follow this cadence. Campaign Monitor’s analytics dashboard brings engagement, deliverability, list health, and revenue attribution together in one place—making ongoing reporting effortless
Wrap up
The processes of collecting and reporting data insights may seem like tedium in some cases, but it offers great potential. The insights you gather are the foundation of your marketing strategy and your guide for tracking your progress.
When combined, these KPIs tell a complete story—from individual campaign performance to long-term audience health. Regular analysis ensures every send gets stronger, smarter, and more aligned with your subscribers’ needs.
Email reporting is all about clear, yet powerful insights that are easy to take action on. Use your insights to continually improve your email marketing strategy and create better-performing campaigns that generate undeniable results for your business.
Turn insights into action with Campaign Monitor
You’ve seen what to track. Here’s how to move faster on the what now—without repeating the metrics you already reviewed.
- Centralize your view: See campaigns, automations, and audience trends side-by-side so you can spot patterns and prioritize work in minutes—not hours.
- Go from insight to change: Create/reuse segments, launch quick A/B tests, and tweak journey steps directly after reviewing results.
- Share and align: Export/share concise reports for weekly, monthly, and quarterly reviews to keep stakeholders focused on the same goals.
- Keep momentum: Use comparisons over time to confirm what’s improving and queue the next optimization.
Ready to turn insights into results? Use Campaign Monitor to track core KPIs, monitor deliverability by domain, review journey reports, see link/click heatmaps, connect GA for conversion tracking, and view client/device engagement—all in one platform.