


Overview
- Integrations: Pull all of your KPIs into one place Tired of logging into multiple tools to see how your company is performing? View all of your performance data in one place so you can spend less time checking data and creating reports and more time acting on insights. Mix and match metrics from different sources in one Databoard and get a more complete view of your performance at a glance.
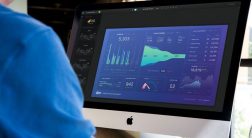
- Dashboard Designer: Build your own dashboards, no coding required With our DIY Dashboard Designer, anyone can pull the metrics they need, visualize KPIs in a variety of ways, and build beautiful dashboards - no code or design skills necessary.
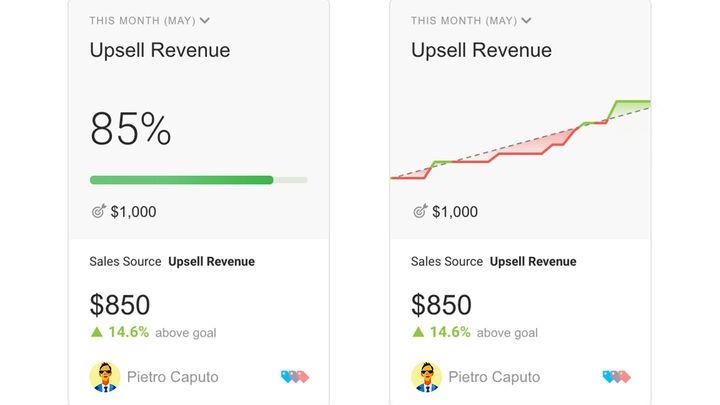
- Goals: Set measurable goals and track your progress Set goals for specific metrics from any of our 70+ integrations or any other data you integrate into Databox. Track them all on one screen or visualize your progress toward them on any Databoard. Keep everyone focused on the metrics that matter most.
- Alerts, Insights & Scorecards: Get performance alerts & recommendations when they matter most. Don't wait until the end of the month or quarter to know how your performance is trending. With Alerts, get notified when performance is off. Scorecards send you updates on your most important KPIs through email, mobile push notifications, and/or Slack every day, week, or month. And the Insights will let you see a stream of your team's achievements and receive recommendations for improving your performance.
- Data Calculations: Easily calculate important business KPIs With Data Calculations, you can combine data from any source and easily calculate new metrics, conversion rates, ROI and much more - all without coding or spreadsheets.
Description
Databox is a decision-making platform built to help you track performance, discover insights and understand what’s going on with your business. It connects your cloud services, spreadsheets, databases and custom integrations to organize all of your business KPIs in one place.
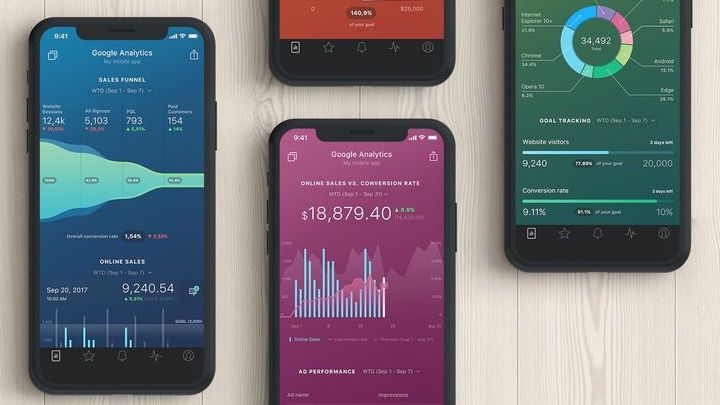
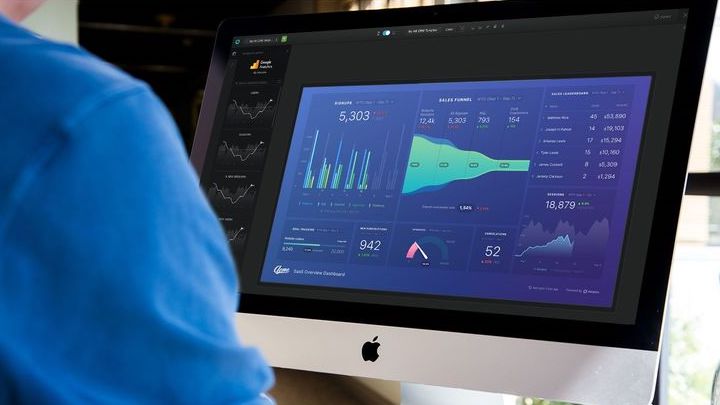
Databox will deliver your metrics via mobile, browser, big screen, Apple Watch®, and even Slack. View analytics data from Campaign Monitor, HubSpot, Google Analytics, SEMRush, Wistia, Drift, Youtube, Facebook Advertising, Instagram, Twitter and many more sources in just a few clicks.
You can easily pull all of your KPIs into one place, build your own dashboards with no coding required, set measurable goals to track your progress and get performance alerts, recommendations or important KPIs delivered to you when they matter most.
This integration provides robust reporting capabilities outside of the Campaign Monitor reporting app. If Campaign Monitor provides an API for the data, we make it possible for you to visualize it in Databox. Used by thousands of Campaign Monitor customers in total, Databox is focused on serving the needs of Campaign Monitor customers.
Installation / Documentation
Setup process:
- Navigate to the Databox Sign Up page and create your account.
- Connect your first Data Source.
- Create a Databoard.
- Track your most important metrics from the Metrics Screen.
- Set Alerts and get important performance updates when they matter most.