Tracking the results of your email campaigns is one of the most effective ways to learn what your audience responds to, and improve your results. When starting out though, it’s tough to know what to compare your results with. If you haven’t really done much email marketing in the past, it’s tough to know what a good open rate, click-through rate, or click-to-open rate is?
Luckily, at Campaign Monitor, we’ve been in the email world for a while. And, as an email service provider that sends literally billions of emails each year, we have some knowledge to share on how you should look at your email marketing metrics.
What is open rate?
Email open rate is the percentage of subscribers who open a specific email out of your total number of subscribers.
Tracking open rates will give you a better understanding of how often people look forward to your emails, how effective your subject lines are, and what type of content is the most interesting to your email list.
How do you calculate open rate?
To calculate it, you’ll simply divide the number of subscribers who opened your email by the number of subscribers the email was sent to. Or, you know, let our analytics tool calculate it for you.
While open rate is a helpful metric, it should never be the only email metric you look at to measure your campaign’s performance. Instead, you should consider multiple metrics and think about the goals you have for your email marketing campaigns.
What is a good open rate for email?
A good email open rate should be between 17-28%, depending on the industry you’re in. While knowing these numbers is a great starting point, it’s worth it to look into your specific industry averages and compare your metrics with those in your specific industry.
What is the average open rate for email marketing & newsletters?
According to our 2022 Email Marketing Benchmarks Report, the average email open rate was 21.5%, across all industries in 2021. This is up 3.5% from 2020.
The industries with the highest open rates, like Education, Agriculture, and Financial Services, average between 25-28%.
Here’s a look at how averages break down, per industry.
| Industry | Open Rates |
| Advertising & Marketing | 20.5% |
| Agriculture, Forestry, Fishing, Hunting | 27.3% |
| Consumer Packaged Goods | 20% |
| Education | 28.5% |
| Financial Services | 27.1% |
| Restaurant, Food & Beverage | 18.5% |
| Government & Politics | 19.4% |
| Healthcare Services | 23.7% |
| IT/Tech/Software | 22.7% |
| Logistics & Wholesale | 23.4% |
| Media, Entertainment, Publishing | 23.9% |
| Nonprofit | 26.6% |
| Other | 19.9% |
| Professional Services | 19.3% |
| Real Estate, Design, Construction | 21.7% |
| Retail | 17.1% |
| Travel, Hospitality, Leisure | 20.2% |
| Wellness & Fitness | 19.2% |
| Average | 21.5% |
What is click-through rate (CTR)?
Click-through rate, or email click rate, is the measure of how many people clicked on a hyperlink, call-to-action (CTA), or image within your email’s content.
The main goal for tracking click-through rate is to measure engagement. Using click-through rates, you can gauge performance in the following areas:
- Overall brand interest or email fatigue
- Email content (written and visual)
- Link placement
- Link count
- Media type
Since CTR shows the percentage of subscribers who clicked your email, it’s a good indicator of what percentage of your audience is interested in your content over time.
How do you calculate click-through rates?
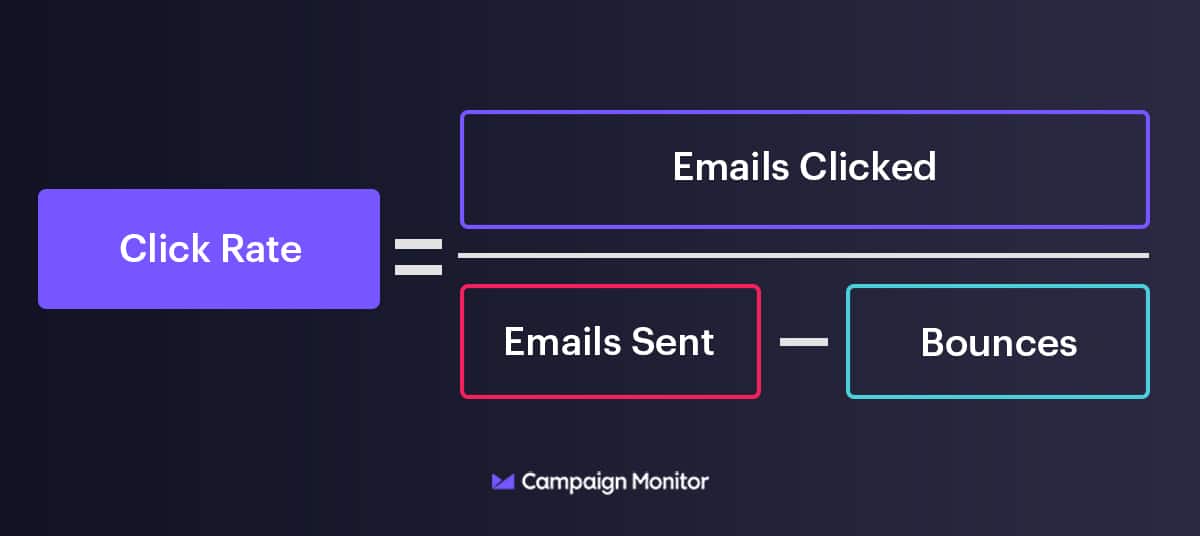
Click-through rates can be calculated by taking the total number of clicks an email receives, and dividing that number by the total number of delivered messages. Here’s what that equation looks like:

What is a good click-through rate for email?
A good click-through rate should be between 2-5%, depending on the industry you’re in. For more industry-specific metrics, we’d suggest checking out our report.
What is the average click-through rate for email marketing?
In 2021, the average email open rate was 2.3%, across all industries. This is down 0.3% from 2020. The industries with the highest click-through rates — like Education, Real Estate, and Agriculture — average between 3-5%.
Here’s a look at how averages break down, per industry.
| Industry | Click-Through Rates |
| Advertising & Marketing | 1.8% |
| Agriculture, Forestry, Fishing, Hunting | 3.4% |
| Consumer Packaged Goods | 1.9% |
| Education | 4.4% |
| Financial Services | 2.4% |
| Restaurant, Food & Beverage | 2.0% |
| Government & Politics | 2.8% |
| Healthcare Services | 3.0% |
| IT/Tech/Software | 2.0% |
| Logistics & Wholesale | 2.0% |
| Media, Entertainment, Publishing | 2.9% |
| Nonprofit | 2.7% |
| Other | 2.6% |
| Professional Services | 2.1% |
| Real Estate, Design, Construction | 3.6% |
| Retail | 0.7% |
| Travel, Hospitality, Leisure | 1.4% |
| Wellness & Fitness | 1.2% |
| Average | 2.3% |
What is click-to-open rate (CTOR)?
A metric that marketers aren’t very familiar with is the click-to-open rate (CTOR), which essentially measures the effectiveness of your email’s content.
Because it’s based on the number of unique opens, CTOR is a good indicator of how interesting your content is to your subscribers. If your links, layout, copy, and overall content are interesting, then your readers will want to click through to learn more.
How do you calculate click-to-open rate?
Click-to-open rate is calculated by dividing the number of unique clicks by the number of unique opens.
For example, 100 clicks / 180 opens (multiplied by 100 for a percent) = 55%. As with all other email metrics, this can fluctuate based on how awesome your content is.
To best understand and report on your CTOR, we recommend creating your own benchmarks, rather than going by average numbers. Why? Because factors like industry, list size, and others all play into CTOR. So, when measuring your audience’s interest in your content, it’s best to compare to your own internal metrics to learn what your audience is responding to.
Looking at the CTOR numbers for each of your email campaigns is a great place to start. Better yet, if you send different email types, track the CTOR for each type. This may include tracking your newsletter, welcome email, or one-off campaign to find out how effective your content marketing is and where you can make improvements.
What is a good click-to-open rate for email?
A good CTOR should fall between 6-17%, depending on the industry you’re in. Again, to get a good idea of the kind of metrics you should expect, we recommend looking at your specific industry.
What is the average click-to-open rate for email marketing & newsletters?
In 2021, the average click-to-open rate was 10.5% across all industries. This is down 3.6% from 2020. The industries with the highest CTORs — Real Estate, Education, Government & Politics — average between 14-17%.
Here’s a look at how averages break down, per industry.
| Industry | Click-to-Open Rates |
| Advertising & Marketing | 9.0% |
| Agriculture, Forestry, Fishing, Hunting | 12.5% |
| Consumer Packaged Goods | 11.1% |
| Education | 15.7% |
| Financial Services | 10.1% |
| Restaurant, Food & Beverage | 10.5% |
| Government & Politics | 14.3% |
| Healthcare Services | 13.4% |
| IT/Tech/Software | 9.8% |
| Logistics & Wholesale | 11.7% |
| Media, Entertainment, Publishing | 12.4% |
| Nonprofit | 10.2% |
| Other | 13.2% |
| Professional Services | 11.1% |
| Real Estate, Design, Construction | 17.2% |
| Retail | 5.8% |
| Travel, Hospitality, Leisure | 8.7% |
| Wellness & Fitness | 6.0% |
| Average Totals | 10.5% |

Dive deeper into understanding email metrics
There’s a lot to understand when it comes to deciphering email metrics, and we’ve just scratched the surface in this post. Here are some resources we recommend for diving deeper into email performance and analysis.
- Tips for Improving Your Email Open Rates
- Get Your Personalized Email Marketing Score
- 17 Email Marketing Metrics Every Marketer Needs to Know
- Why Email Campaign Reporting Is Important (And How to Do It)
- Free course: Email data and reporting
- Introduction to Email Insights and Reporting
Thanks, and good luck!