Article first published August 2014, updated May 2019
Are you struggling to measure the bottom line impact of your email marketing?
You know what your open and click-through rates are, and you can even see every individual who opens your email on a big, beautiful map. Yet, somehow, you still can’t quite measure how many leads and customers your email campaigns are creating.
Fortunately for you, email marketing tools like Campaign Monitor integrate directly with Google Analytics, so you can see how many people are clicking on your email campaigns, landing on your website, and going on to become leads and customers.
The best part is: It’s really easy to do. Read on to discover three simple steps to help you make it happen.
1. Set up campaign tracking
The first step to tracking the success of your email campaign is setting up Campaign Tracking. When people come to your website from other sites like Twitter and Facebook, it’s easy for Google Analytics to know where they came from and tag the traffic appropriately (as “social traffic,” for instance). However, in the case of email, if you don’t use these little things called “UTM variables,” traffic from your email campaigns will be classified as “Direct.”
UTM variables are basically little parameters you can add to the end of your links in email campaigns to tell Google Analytics where the person is coming from.
Let’s look at our recent Canvas email campaign as an example. Here’s what the link would look like with and without UTM variables:

See all the extra parameters appended at the end of the URL? These tell Google Analytics where the person is coming from.
Although these links look crazy, they’re easier to set up than you think. You have two options: You can either tag all your links manually, or, if you’re a Campaign Monitor customer, you can turn on automatic link tagging.
How to tag links manually
To tag the links in your emails manually, you can use the Google Analytics URL Builder. This free tool is provided by Google Analytics, and it allows you to fill out a few fields and get a nicely coded link you can put straight into your campaigns.
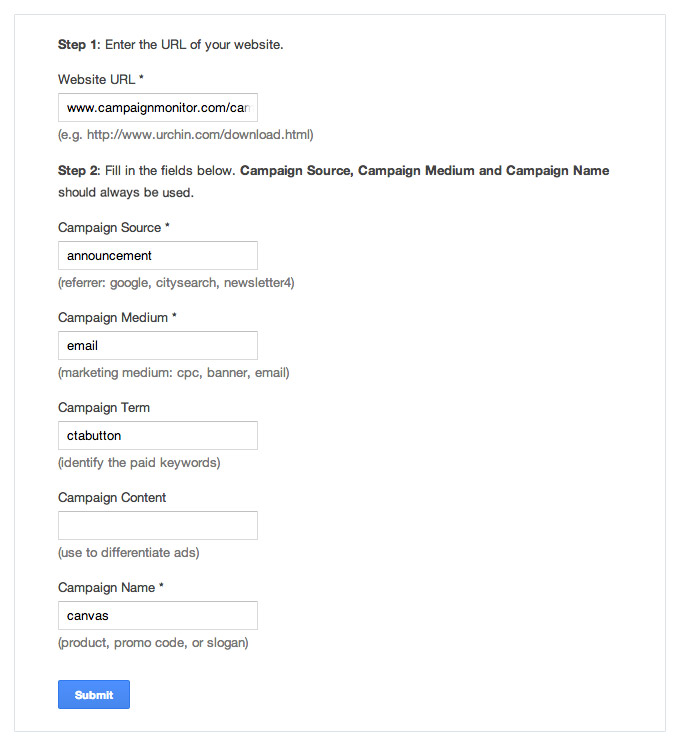
You can enter whatever values into the form you need, but, in the above example, we created a URL that tells Google Analytics we are:
- Tracking a custom campaign named “canvas.”
- The campaign source is the “announcement” email.
- The campaign medium is “email.”
- The link clicked upon by the subscriber is the “CTA button,” referred to as the campaign term.
Now all you need to do is copy the link the tool provides and use it behind the buttons and links in your email campaigns.
How to tag links automatically
If this seems overly difficult, we completely understand. That’s why we built automatic link tagging into Campaign Monitor. It allows customers to simply flip a switch and all the links in their campaigns are automatically tagged with UTM variables.
To turn it on, follow the instructions found in this help article.
Once enabled, we’ll automatically add the following UTM variables to your email campaigns:
- utm_medium = email
- utm_campaign = the email campaign name (not subject line)
- utm_content = the email campaign name plus a unique campaign identifier (CID)
- utm_source = only included if you supply a source term
- utm_term = the link text, or alt attribute (for images)
2. Create an advanced segment
Advanced Segments are essentially filters which allow you to see data in your reports from specific visitors, such as visitors from search or visitors from email.
To create a segment, click on the Add Segment box above any of your standard reports.
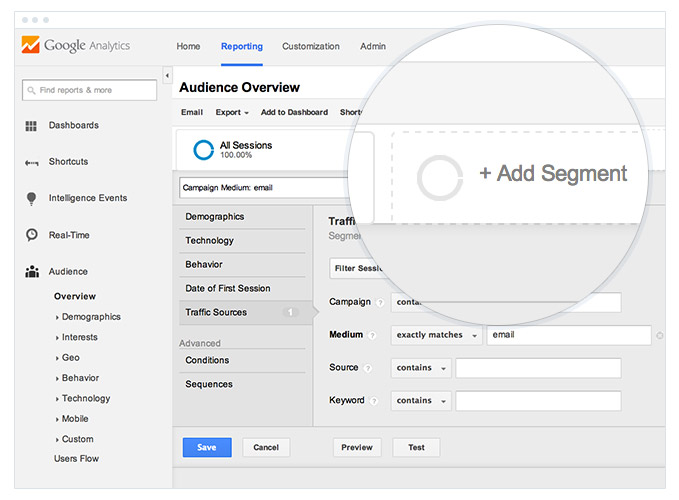
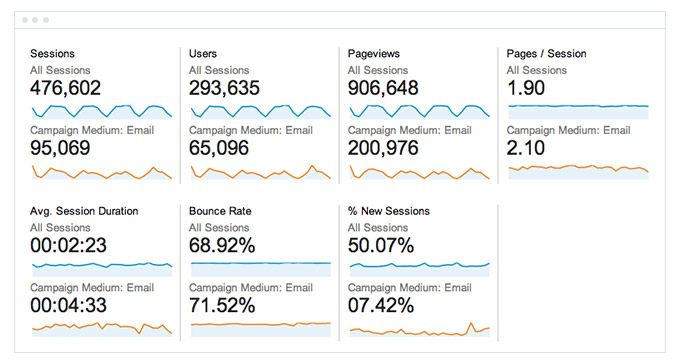
For this example, we’re going to only view website visitors who have come from an email marketing campaign. To do this, click the red button to create a new segment and name it Campaign Medium: email. In the left menu, select Traffic Sources, and, for the Medium field, select Exactly Matches and type in “email.”
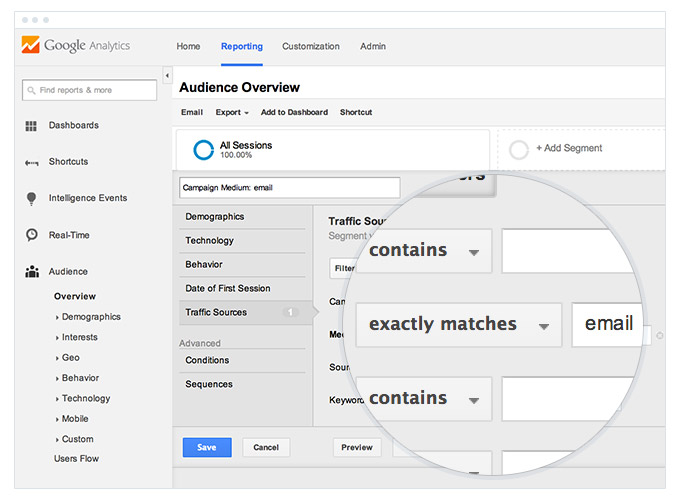
When completed, click Save. You can use the same Add Segment box to find your new segment and apply it to your reports. Once you do this, you’ll see numbers for people who came via your email campaigns alongside your usual metrics, like in the example below:
3. Review your reports
Now that you have enabled Campaign Tracking and have set up email traffic as an Advanced Segment, you can look at virtually any report in Google Analytics and see the effect your email marketing campaigns have on the numbers.
To get you started, here are four of our favorite reports for understanding the effect of your email marketing campaigns:
The Real-Time report
If you have just sent an email campaign to your list, it can be interesting to watch in real time as they start to click through to your website and navigate around.
The real-time report can be accessed by selecting “Real-Time” from the left menu bar and then selecting “Traffic Sources” and “Email.” Here’s what our report looked like at the time this article was written:
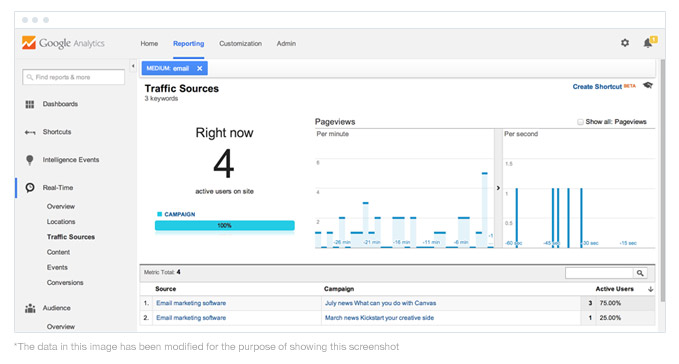
As you can see, the report will show you how many people are on the site right now who have come from your email campaigns, and will even break down what campaigns they came from.
The Overview report
Just need to see how much traffic your email marketing efforts are bringing to your site and compare that to overall traffic? Overview report is the one for you.
To access it, make sure you have your “Campaign Medium: Email” advanced segment turned on, then simply select “Audience” from the left side menu and choose “Overview.”
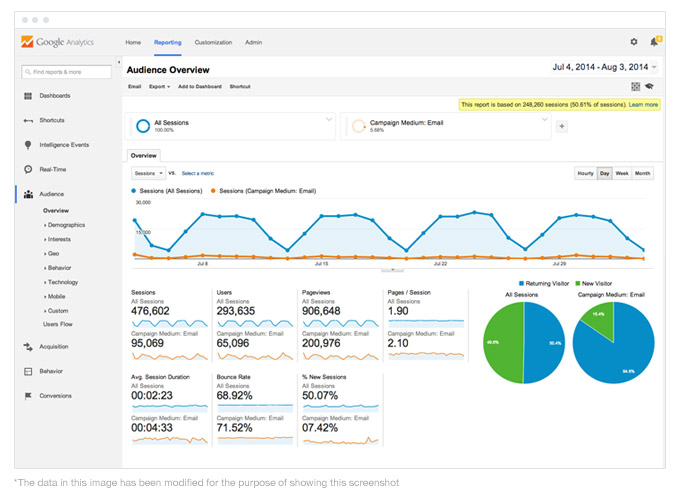
In this single snapshot, you’ll be able to see how many visits (now called Sessions) your email campaigns drove, as well as how many unique visitors (now called Users) arrived. You can also see the number of pages per visit and the bounce rate.
Additionally, you can easily compare all of these metrics to your overall results, or to other mediums like social or search if you add some other Advanced Segments.
The Campaign report
If you want to see the bottom line effect of all your campaigns and compare them against each other, then the Campaign Report is where you want to be.
Make sure you have your “Campaign Medium: Email” advanced segment turned on and navigate to “Acquisition” in the left menu bar. Then select “Campaigns.” Next, you’ll want to select the “Campaign” link just above the table to sort the table by the highest performing campaigns.
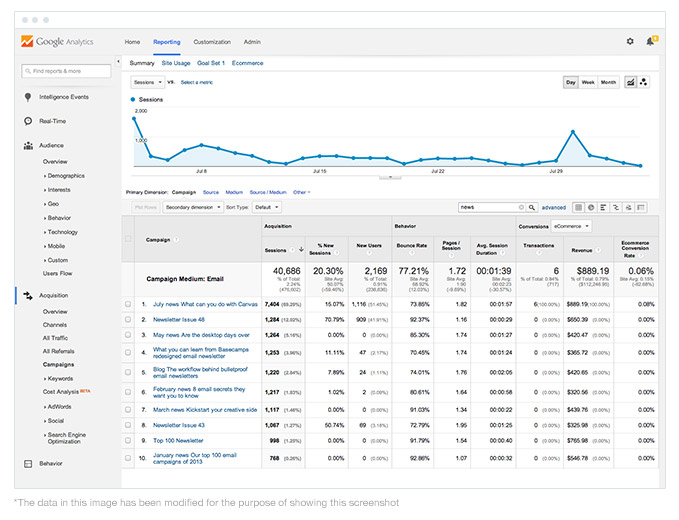
As you can see above, the report will show how many visits (called Sessions) and visitors ( called Users) each campaign brought to your site. If you have goal tracking or e-commerce tracking set up, you can even see how many people made purchases, or another form of conversion from each campaign.
The Behavior Flow report
Have you ever wanted to know what people do on your site once they arrive from your email campaign? Do they just leave? Or do they view your Pricing or Contact Us pages?
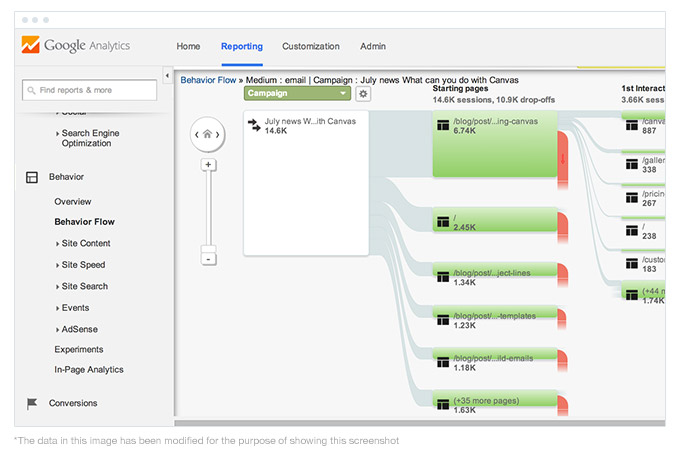
Fortunately, the behavior flow report can tell you exactly what people do when they arrive at your site from a particular campaign.
To access it, select “Behavior” from the left hand menu and then select “Behavior Flow.” Next, you’ll need to select “Campaigns” from the little green drop-down menu above the first column in the report. This will show you all your campaigns, and, if you want to see one particular campaign, just click it and choose “View only this segment.”
