5 minute read time
Email Marketing Benchmarks: Higher Ed Edition

Introduction
It’s hard enough to disseminate information across the various departments of your university or college under normal circumstances, but this year has posed an entirely new set of obstacles. Email is a simple, cost-effective way for you to share information fast—but it only works if your audience engages with your messages.
Turns out, not only are higher ed institutions sending more email than ever, more people are reading, clicking, and engaging with them, too.
To help you during this time, Campaign Monitor has partnered with our sister brand, Emma, to bring you up to date email metrics so you know exactly how your institution compares based on hundreds of millions of emails sent by other organizations in your industry.
Below, you’ll find the most recent open rates, click-to-open rates, and click-through rates for higher ed organizations. Are you above or below the benchmarks? Either way, there’s always room to improve.
After you’ve looked at the data below, download the guide to see what these numbers mean for you and how you can maintain this momentum to best serve your audience.
Because the better your email is, the more informed your audience is. And these days, nothing is more important than that.
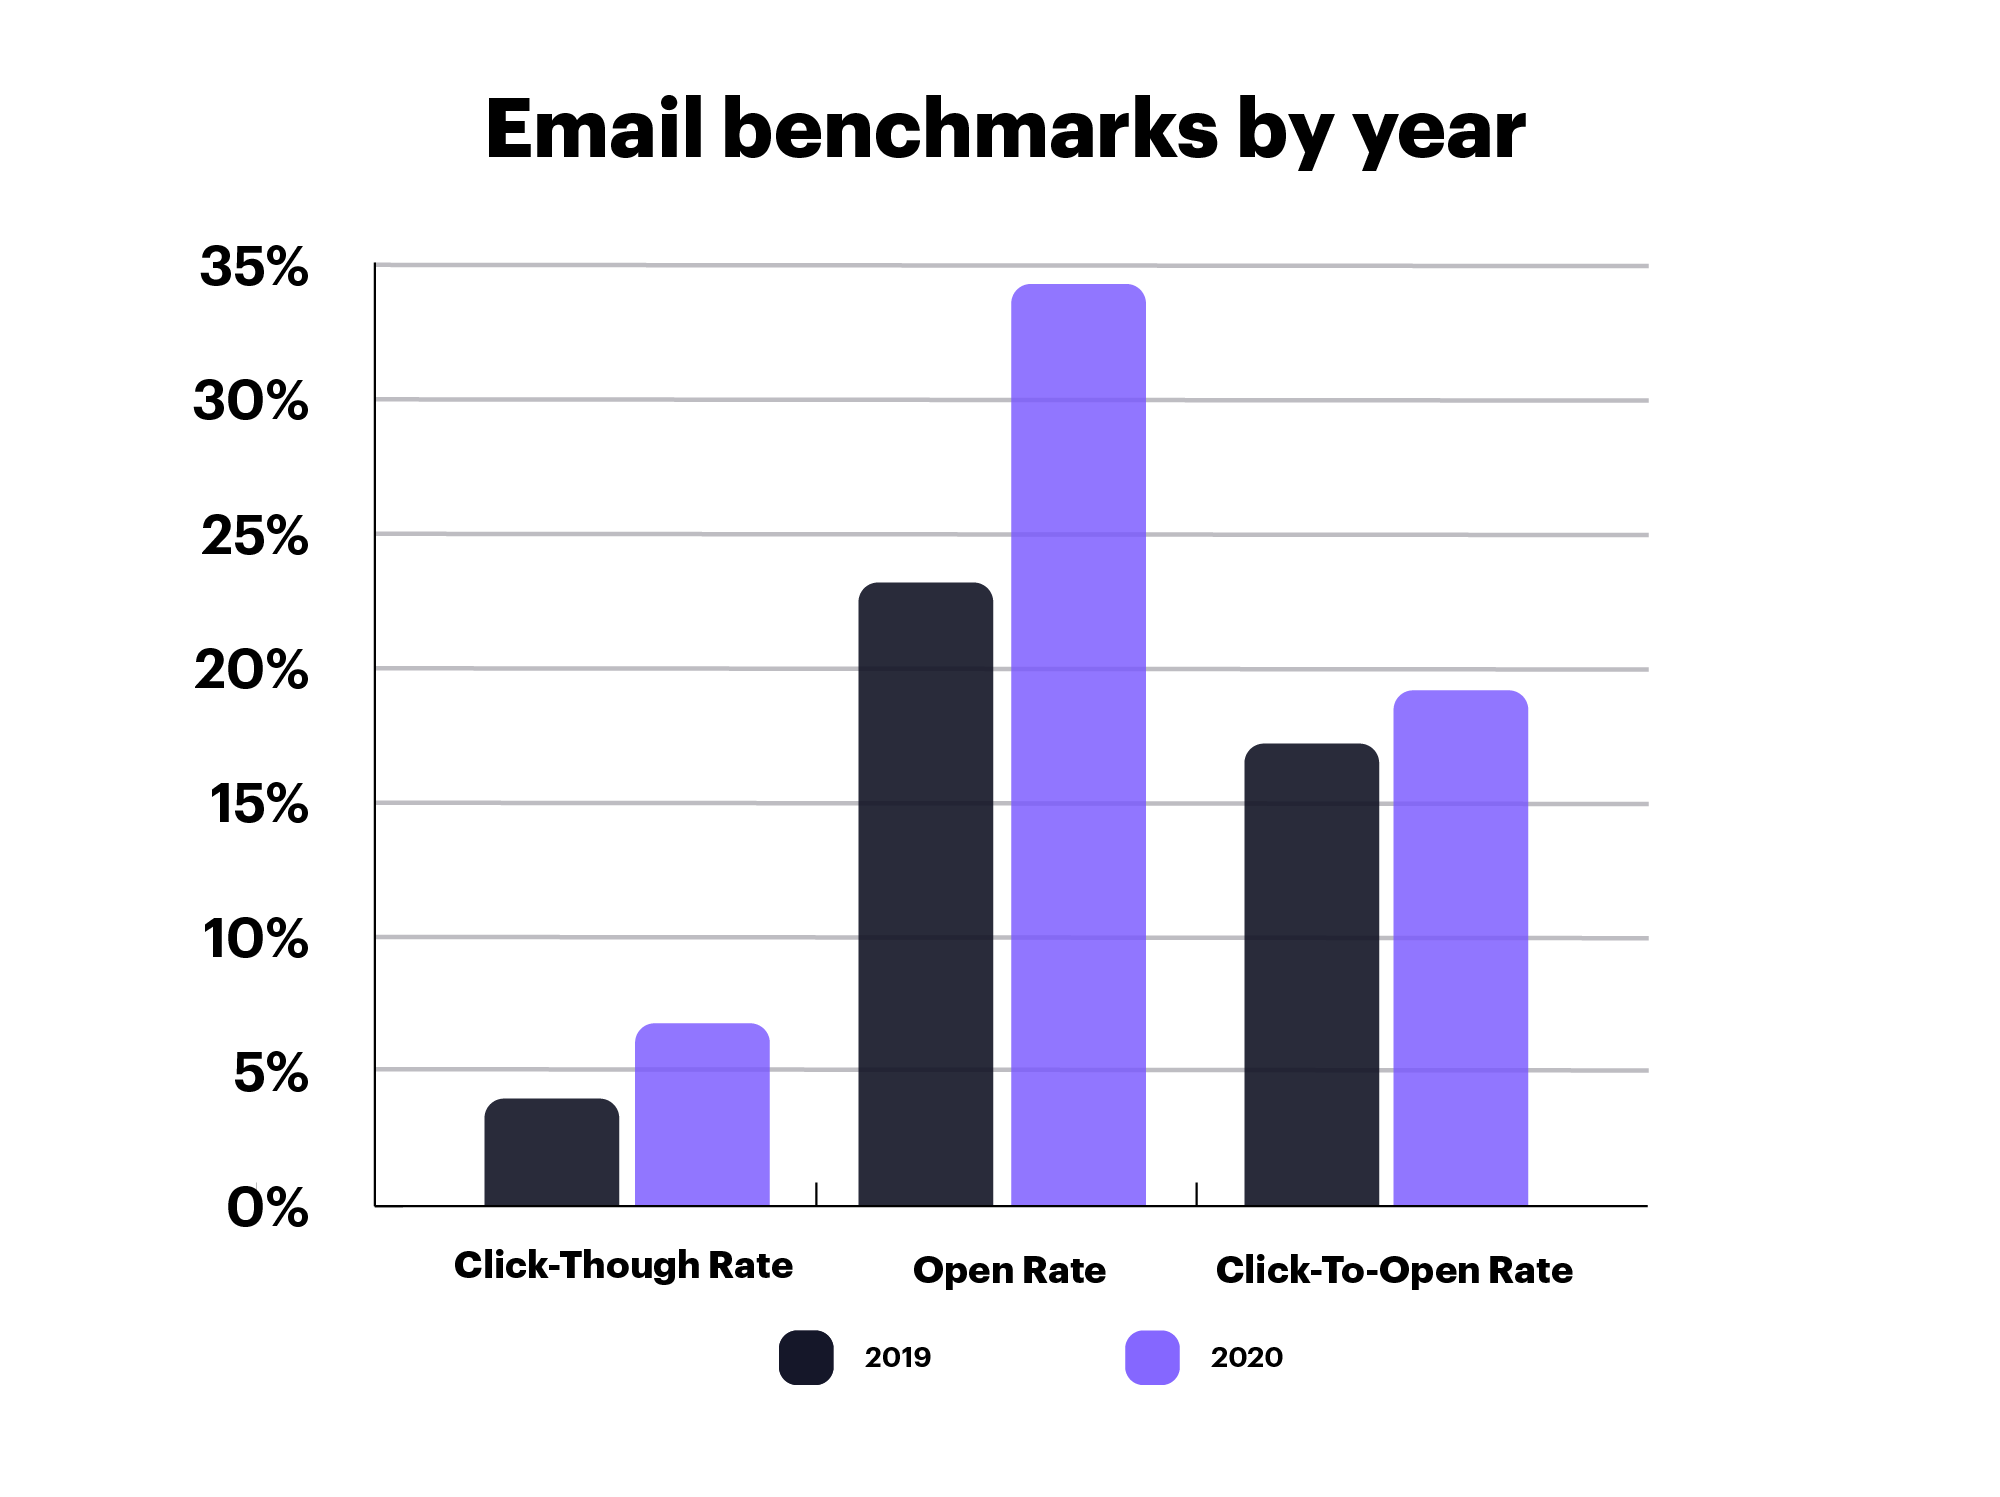
Email benchmarks by year
First, here’s a look at 2019 and 2020 email metrics. Like we already mentioned, this tumultuous year has meant better engagement for email:
Universities and colleges are sending more email than ever, and audiences are engaging at a record-setting rate.
For this graph, we looked at the emails sent between January and September of the specified year.
Note: Unsubscribe rates and bounce rates are often included in our benchmarks, but those metrics remained consistent, making their inclusion redundant. For simplicity’s sake, we left them off the graphs. The unsubscribe rates stayed at 0.1% and bounce rates hovered around 0.6%.
To see what these metrics mean for you—and how you can improve yours if you fall short—download the guide.
Email benchmarks broken down by month
Let’s look at how people engaged with email each month since universities experience seasonal increases in sending volume that can have an effect on engagement. COVID-19 has also forced universities to send more emails depending on when they made changes to their class schedule and other activities on campus. To see what these metrics mean for you—and how you can improve yours if you fall short—download the guide.
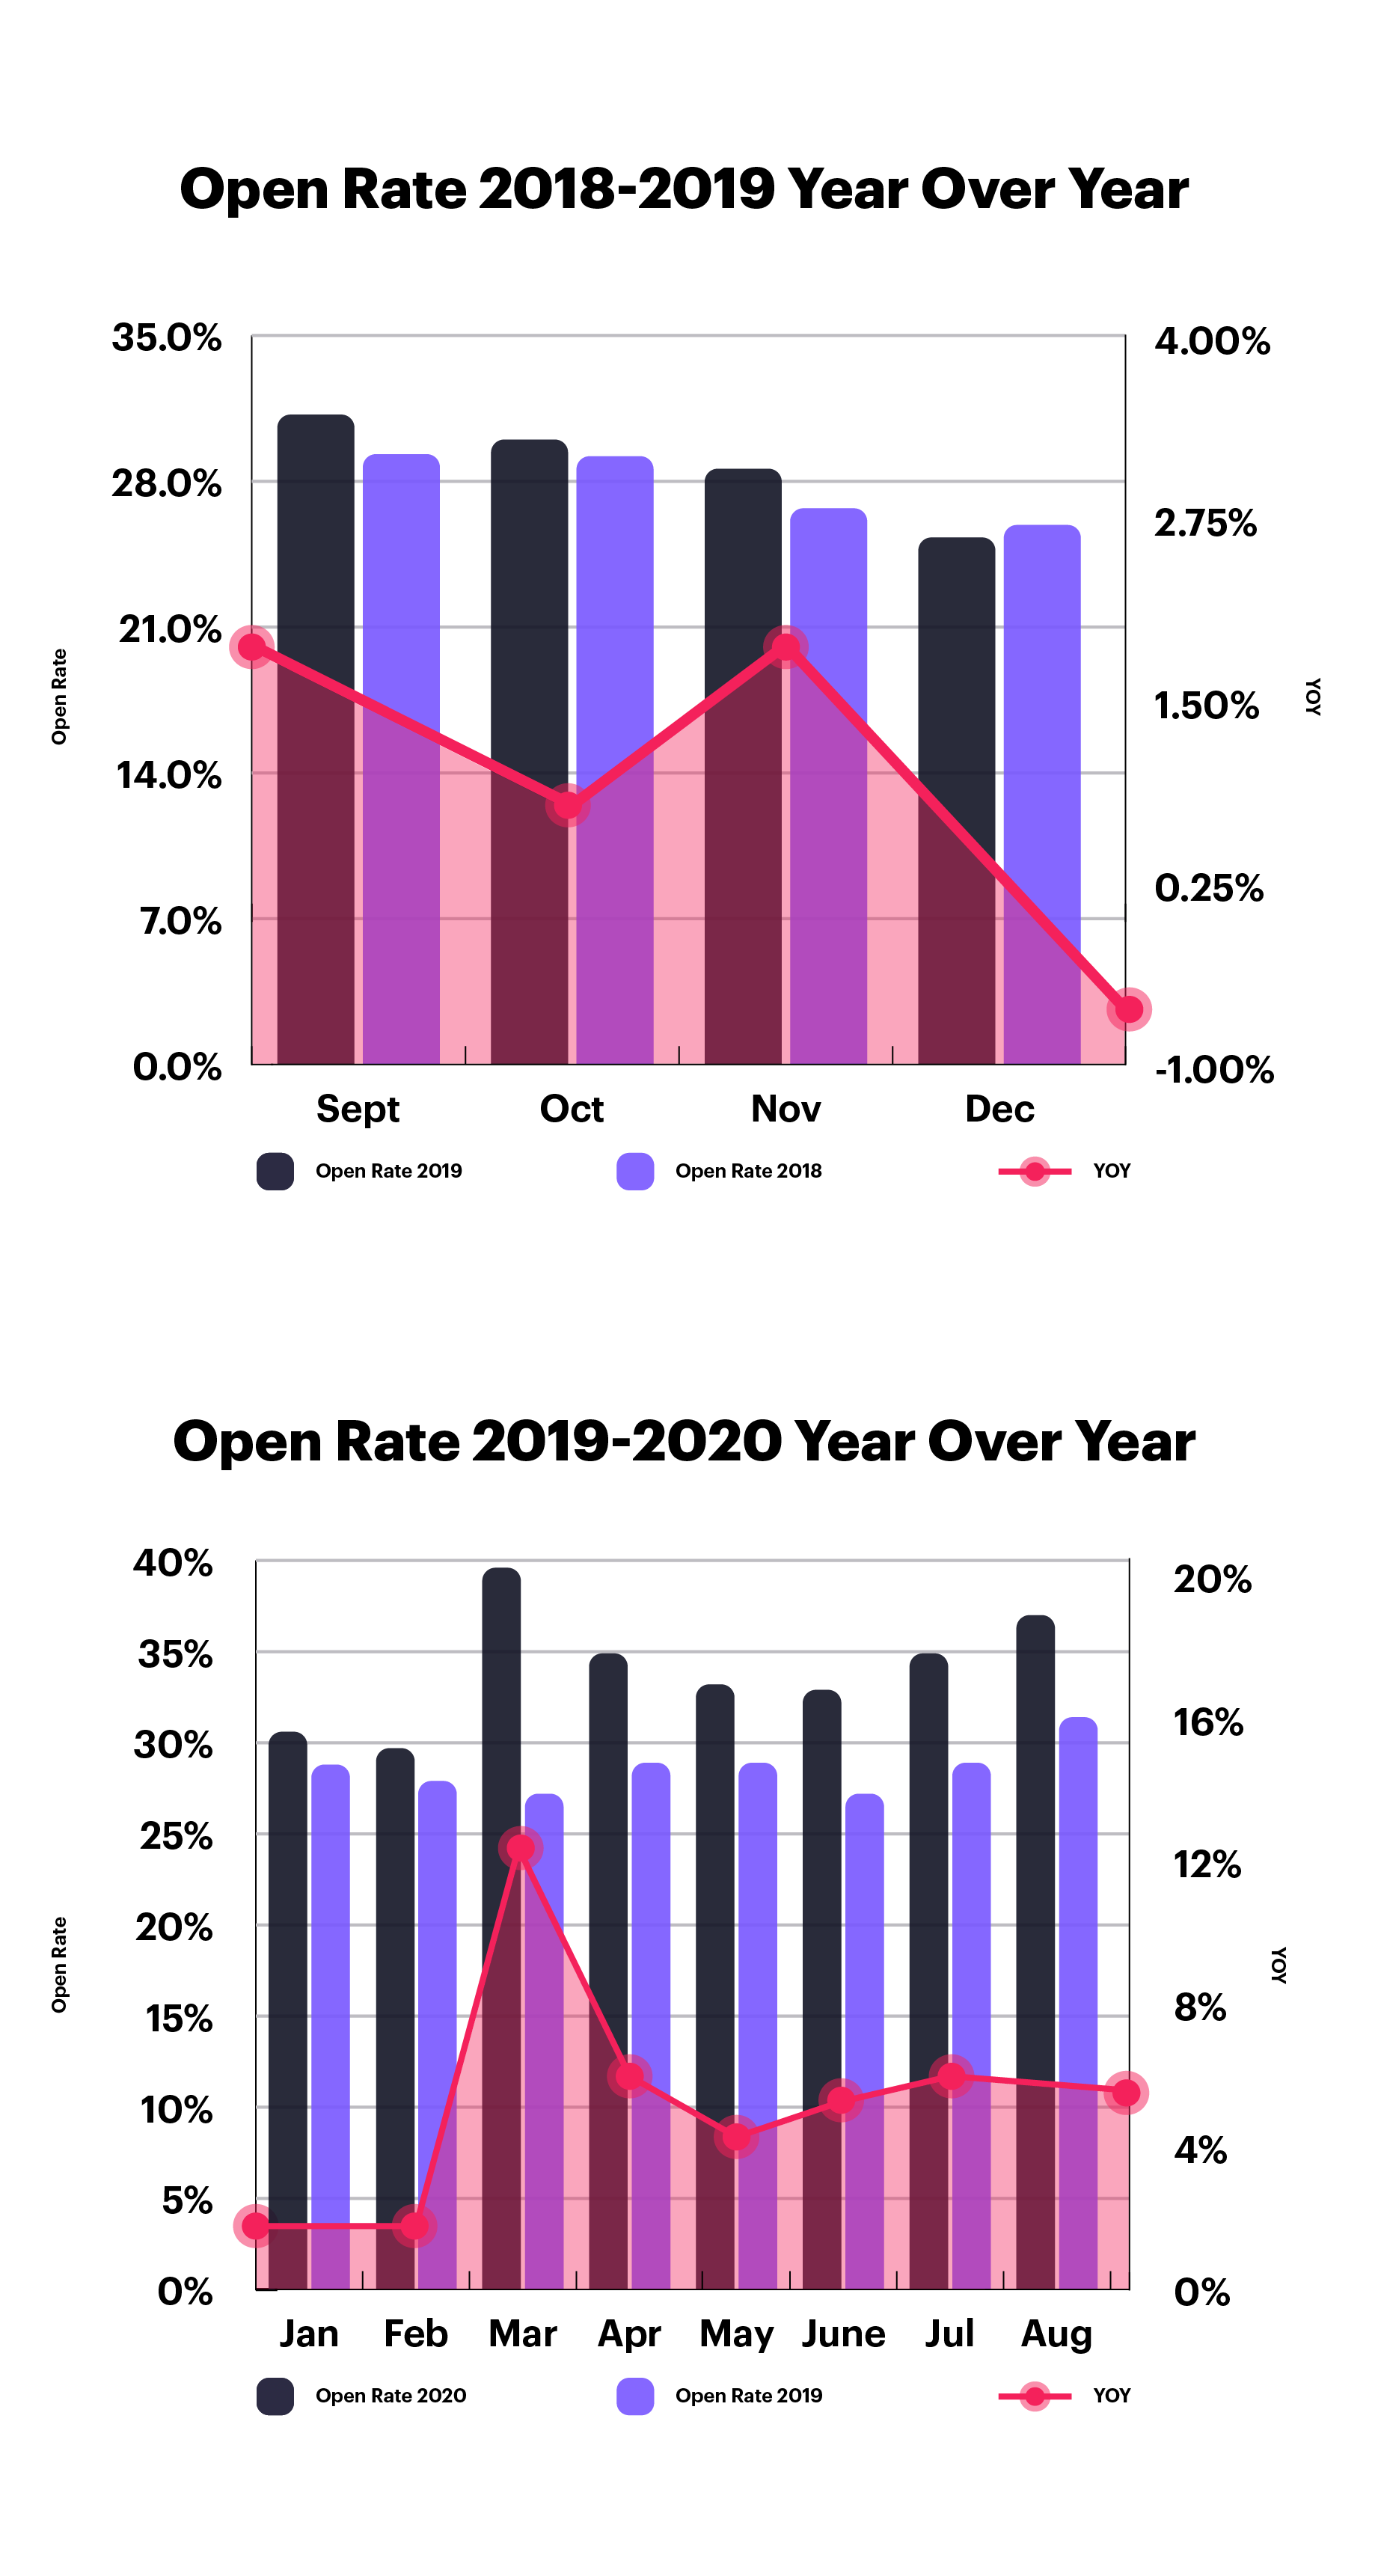
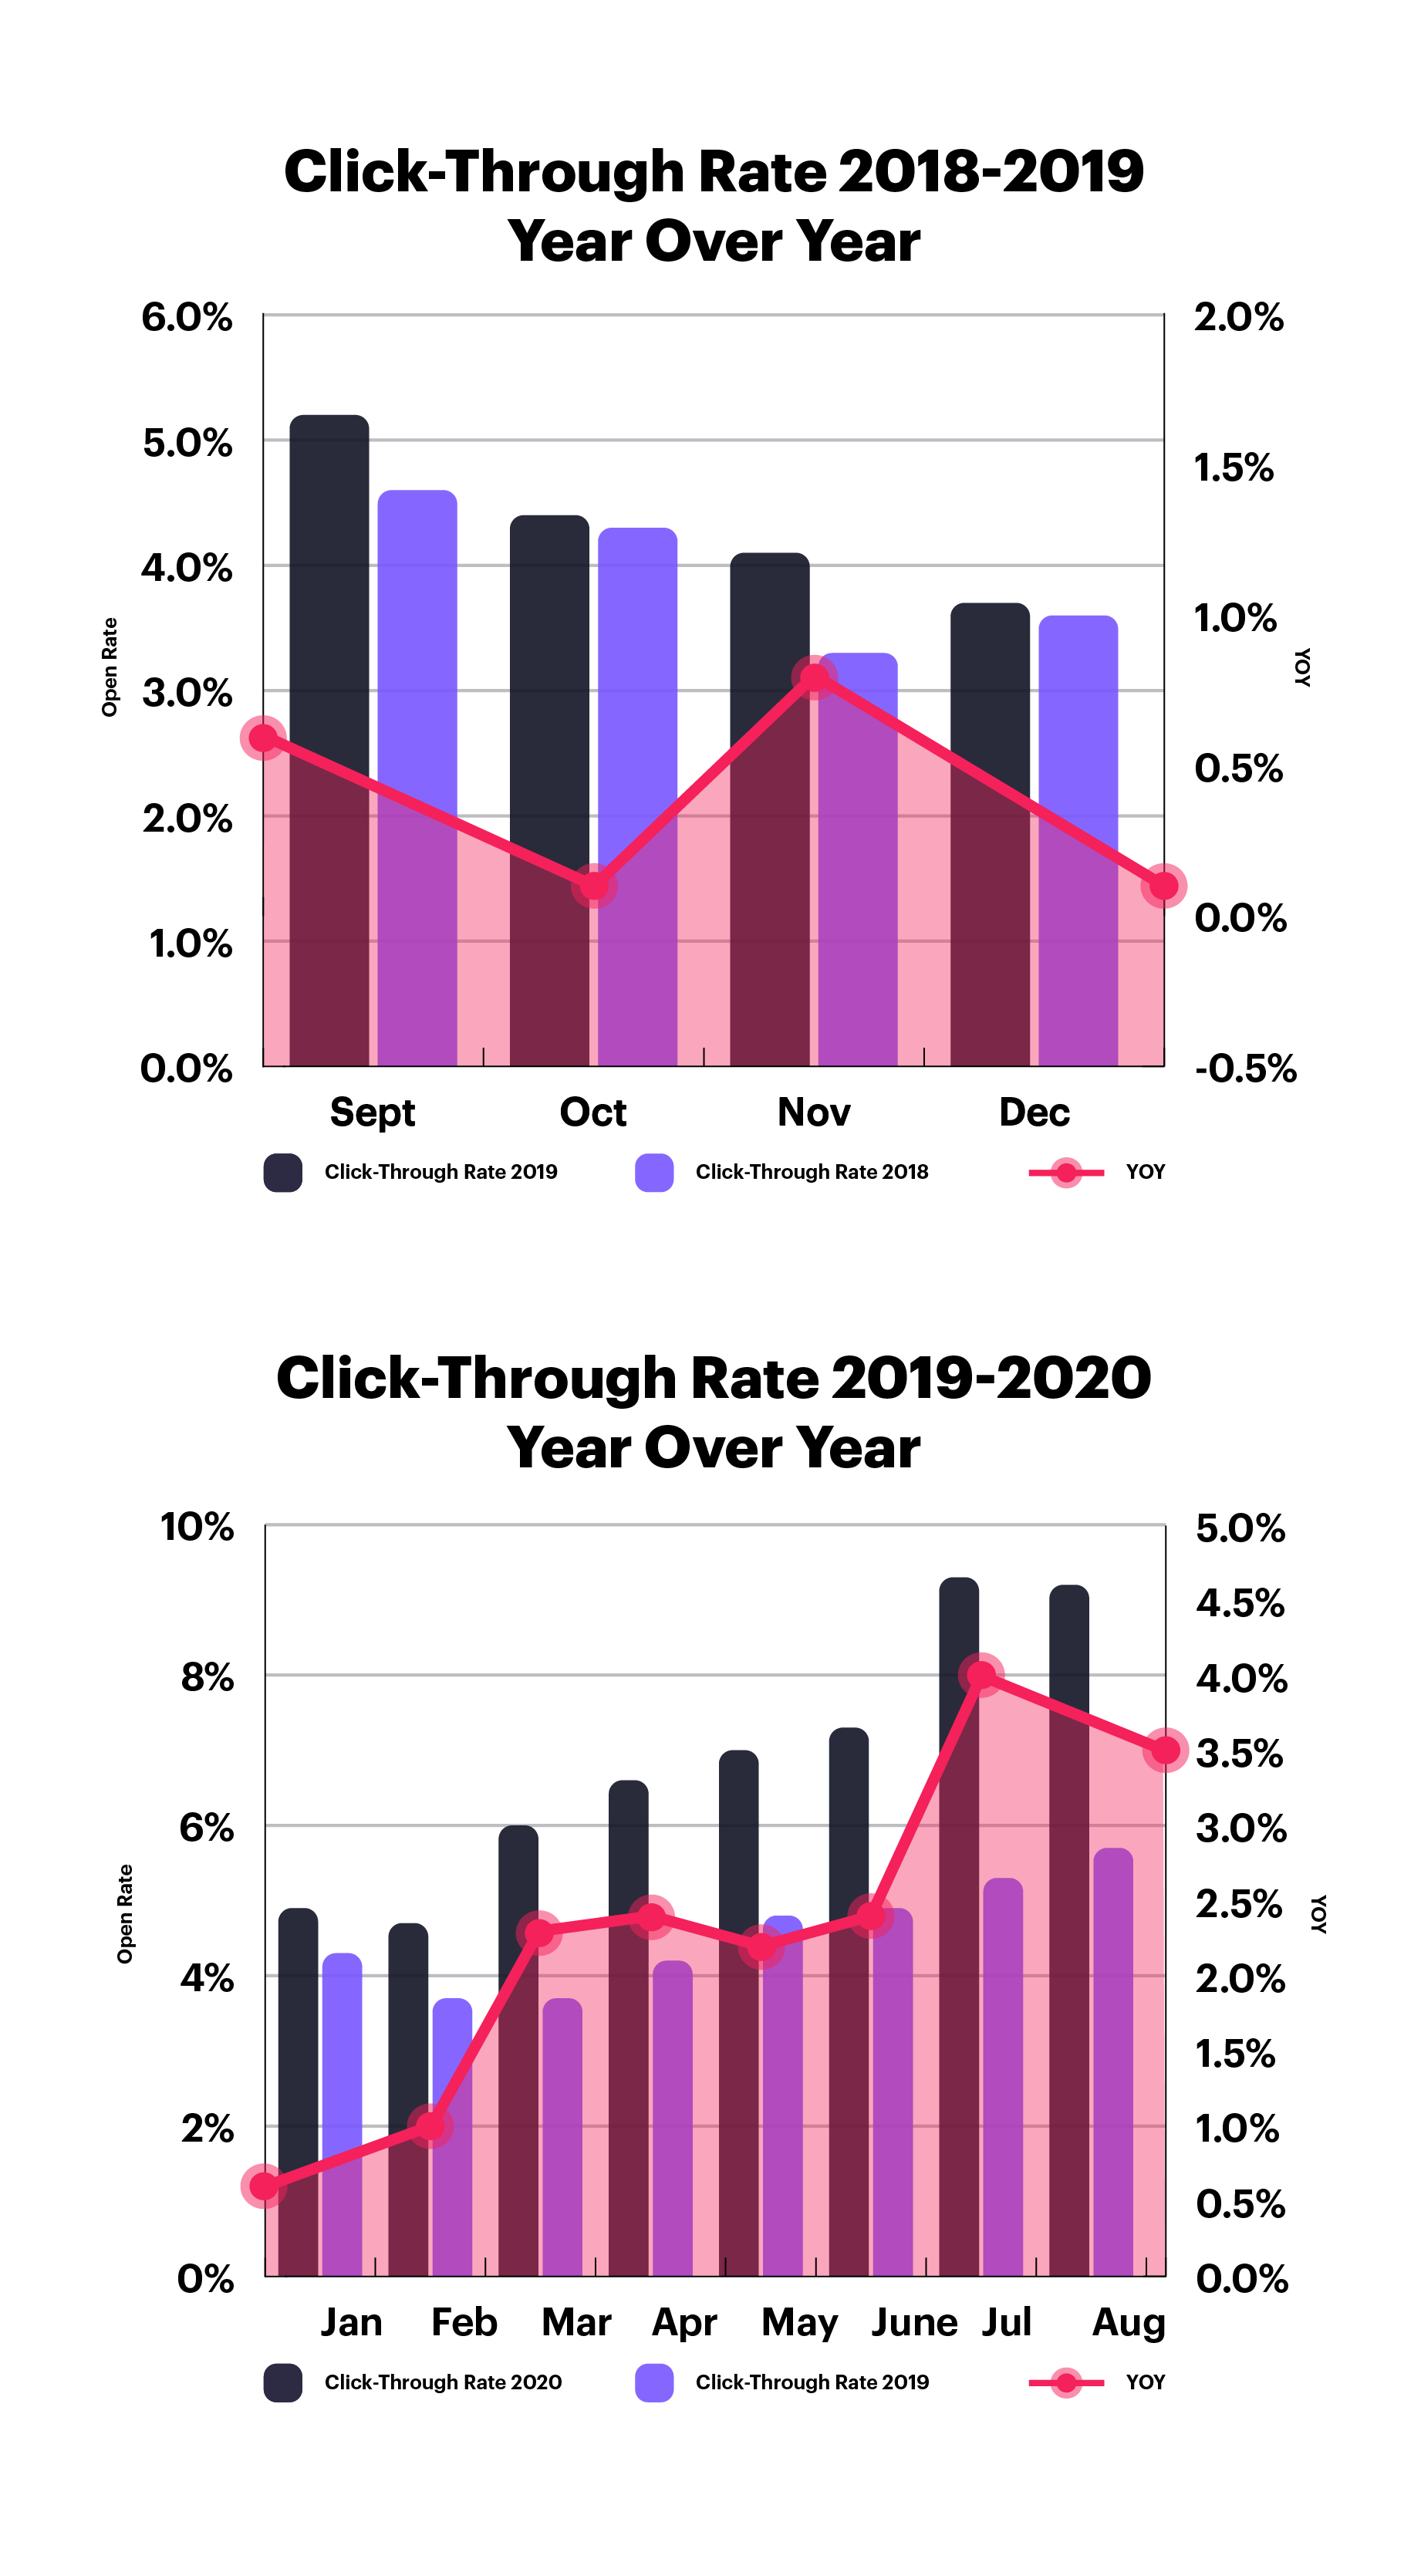
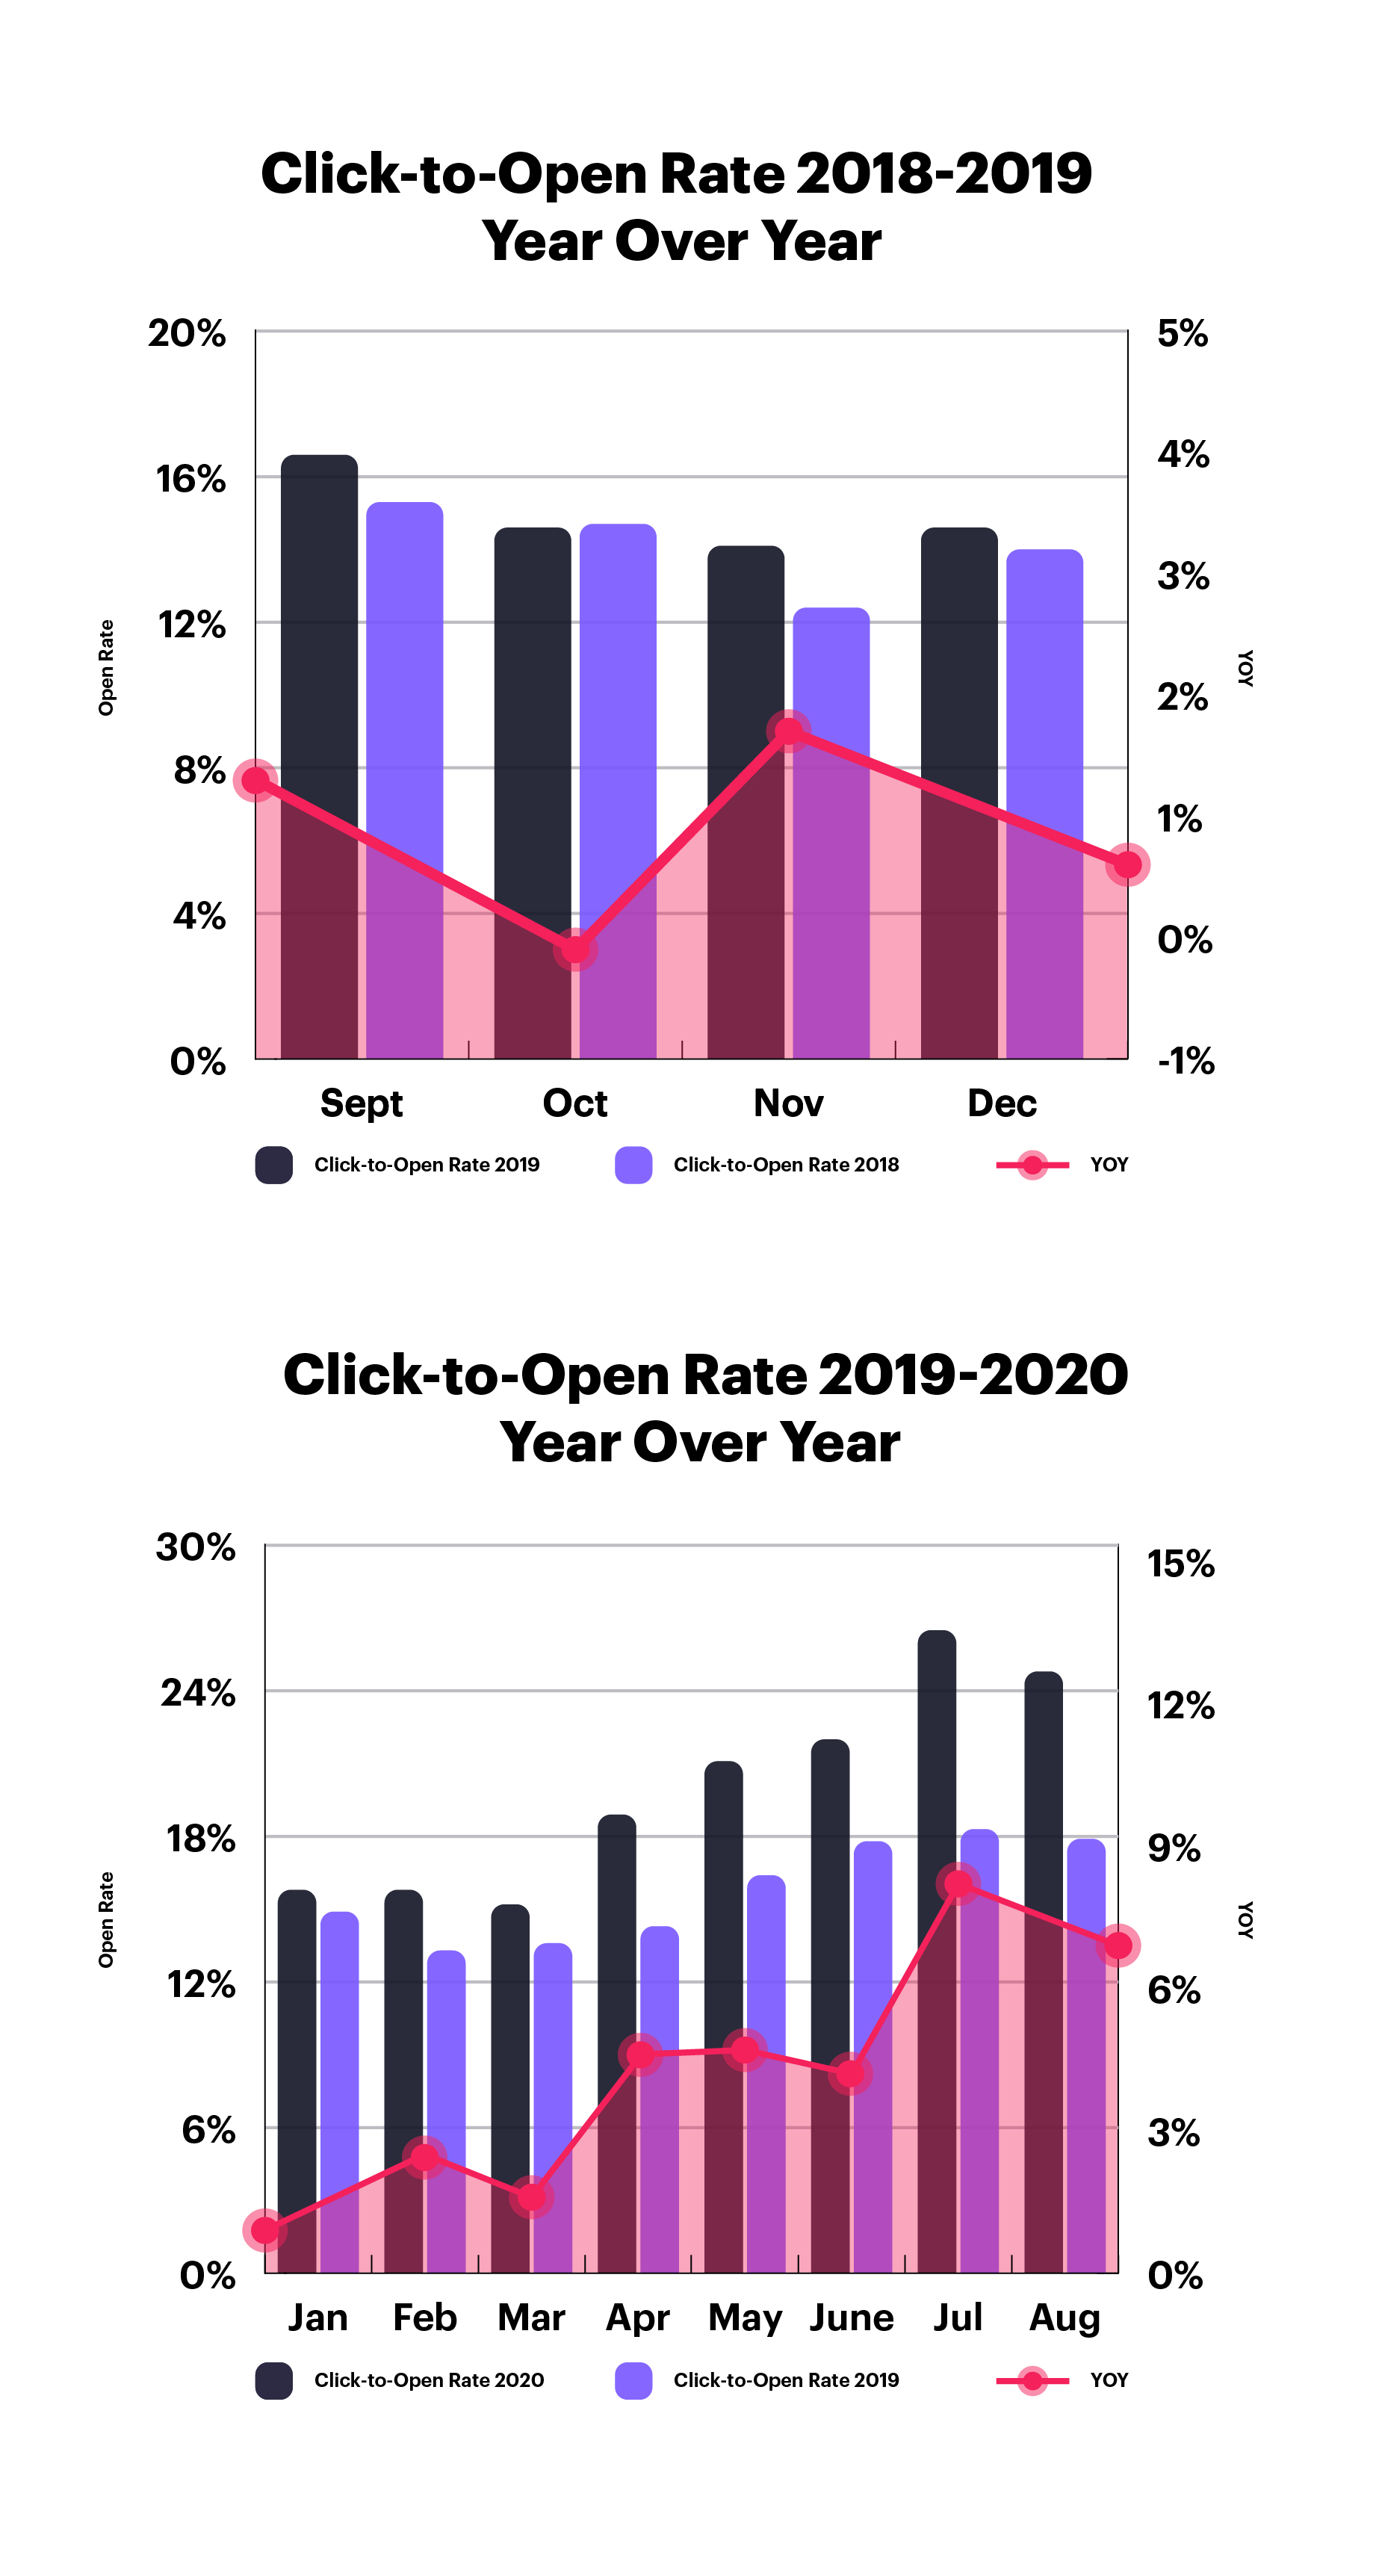
What happened in March?
Here in the US, March really saw a big uptick in cases. It’s also when many institutions switched to online learning after Spring Break.
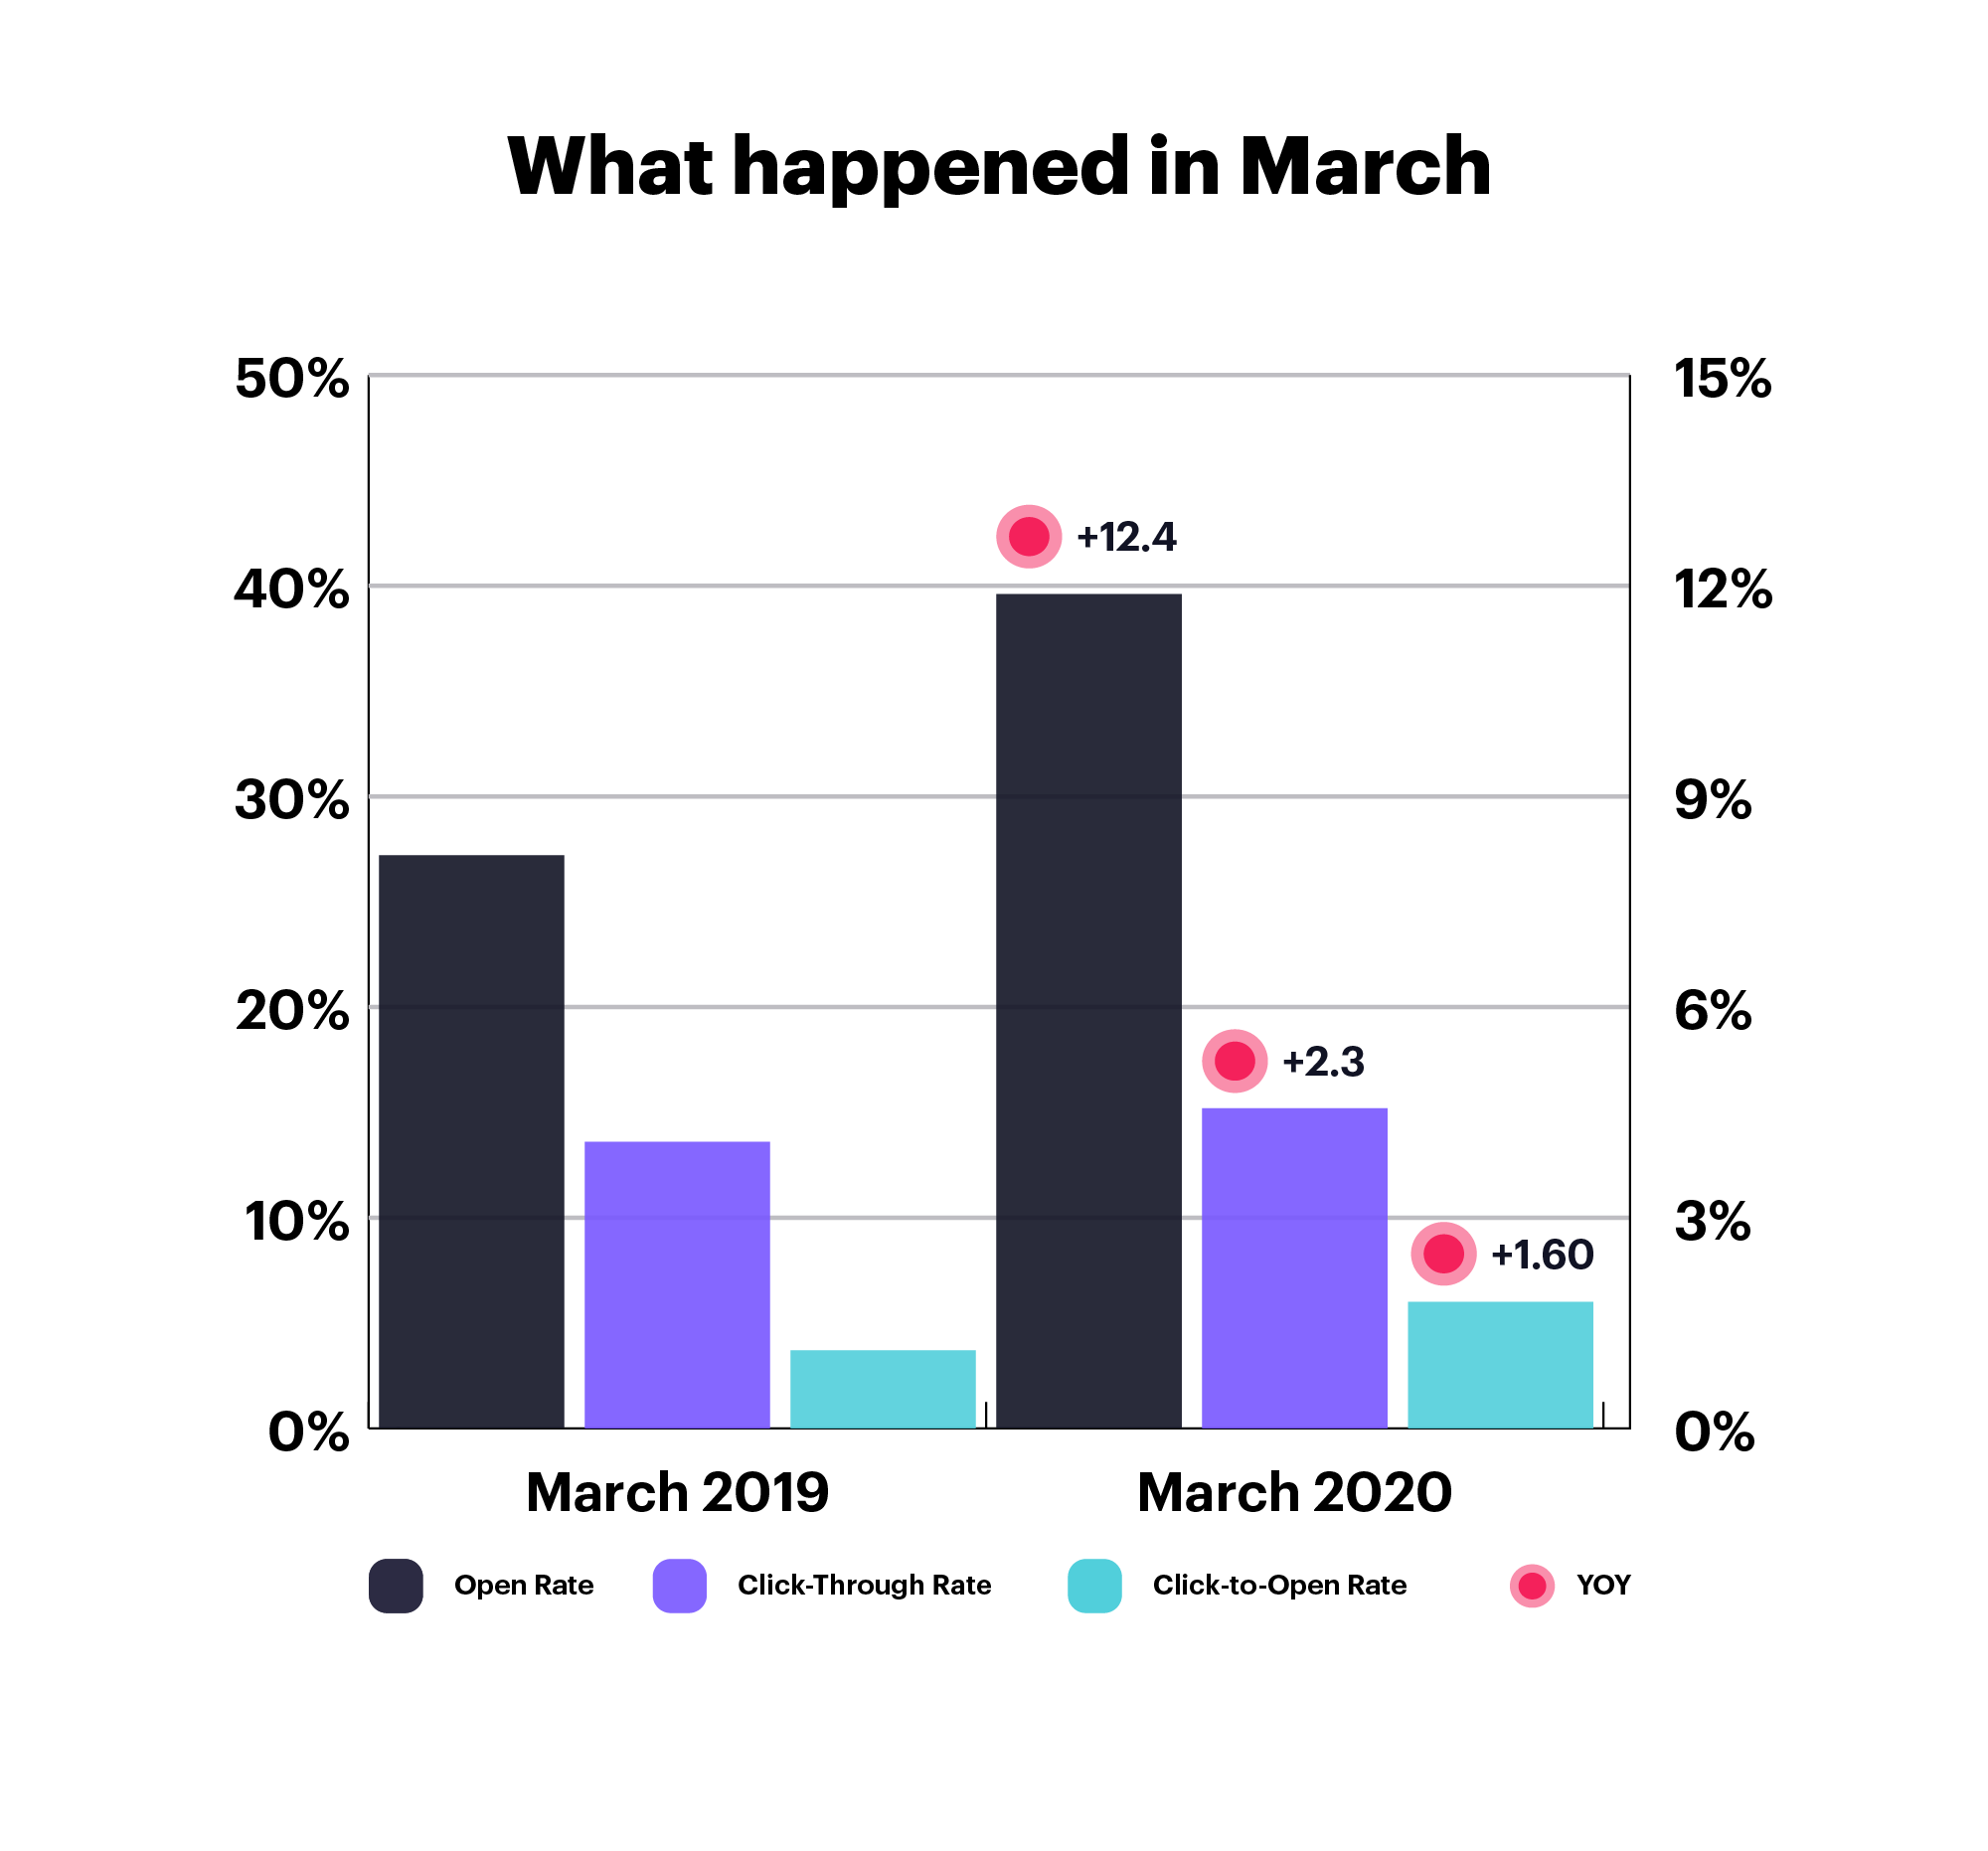
You can see that March experienced a massive shift this year, no doubt related to COVID-19 and the increase in email communications institutions were forced to send.
You can also see that people stayed engaged despite the onslaught of messages. They needed the information and the engagement rates show it. Now that people have adjusted to the new normal, it’s important that universities and colleges continue to follow best practices in order to keep audiences engaged and informed.
To see what these metrics mean for you—and how you can improve yours if you fall short—download the guide.
Download the insights
Now that you’ve compared your metrics to the industry averages, it’s time to get to work. In our guide, we explain how you can maintain this momentum to ensure your audiences stay engaged and informed for the rest of the year and beyond.
There’s no way to know what the next year—or several—will hold for higher ed, but with the right email strategy in place, you’ll be ready for it. And when you’re confident, your subscribers can be confident, too.
Wrap up
We are always adding to our benchmarks library, so explore the rest of our benchmarks collection for more insights into other industries, regions, and previous years. And don’t forget to check back in the next couple of months for our 2021 report.
To make sure you’re one of the first to get our 2021 report, subscribe to our blog.
Methodology
We looked at hundreds of millions of emails sent from all of the Marigold family of brands in order to bring you the most complete picture of what high ed organizations have been experiencing this year. While many of these universities are located in the US, our sample consists of institutions located across the world.
All universities are customers of Marigold brands and all have self-selected “University” as their industry. Even so, this category also includes colleges and individual schools or departments.
How email benchmarks are calculated
Listed below are definitions for the rates we mention in this report. You’ll also find resources available to you if you have specific areas that need improvement.
Email open rate
Open rates are calculated by taking the total number of opens and dividing by total delivered emails. You can explore more resources on improving open rates in this guide.
Email click-through rate
Click-through rates (CTR) are calculated by dividing the number of clicks by delivered emails. You can explore more resources on improving click-through rates in this guide.
Email click-to-open rate
An email click-to-open rate (CTOR) is determined by dividing the number of clicks by the number of opens, showing the engagement rate of subscribers that actually see the content of your email. You can explore more resources on improving click-to-open rates (and overall email engagement) in this guide.