17 minute read time
How to Use Data to Drive Your Email Marketing

Article first published June 2017, updated November 2019
As a marketer, you know how important it is to use data to fuel your marketing campaigns.
It‘s your job to look at what works and what doesn’t in your campaigns, so you can then optimize them for better results.
As you’ve likely experienced, finding data isn’t hard. Most email marketing providers offer analytics dashboards that show all sorts of information about your performance.
What can be a challenge is finding the specific data you need, as well as finding insights to drive your campaigns.
This post will help you understand how data drives your email marketing campaigns. You’ll also learn the key data you need to have before you launch a campaign and, finally, you’ll see a few ways you can leverage data to improve the performance of your campaigns.
How data drives your email marketing campaigns
One of the best advantages of working in the digital world is you can measure pretty much everything you want. Do you want to find out how many people see your ads? No big deal—you have it. Do you want to measure the specific ROI from your content? It’s hard, but it can be done.
In the offline world (the world where you have to talk to people face to face), you don’t have that benefit. You have to guess what’s going on with your marketing campaigns and develop complex correlation models to see whether they’re driving results or not.
Although it’s easy to see the value of data in any marketing campaign (whether that’s email, search, or social), there’s more to the phrase “data is king.” If using data to drive email marketing campaigns were so easy, you wouldn’t get blast after blast of irrelevant emails from companies you subscribed to. Unfortunately, even professional marketers sometimes forget how data can help them.
To understand how marketers should use data for their email marketing campaigns, I’d like to borrow a framework created by the analytics legend Avinash Kaushik, which he called the Trinity.
The Trinity is a holistic strategic approach to analytics with the simple goal of finding actionable insights and metrics. In other words, the Trinity is a way of thinking about analytics to get the data you need to drive your email marketing campaigns (although it can be used to almost any kind of online marketing campaign).
Three elements make up the Trinity. The first element of the Trinity is the “behavior analysis”: the metrics that show what people do on your campaigns. This kind of analysis answers the most basic questions about your campaigns, such as:
- How many people open your emails?
- How many people click your links?
- Which link gets the most clicks?
- What time do people open your emails?
- How many unsubscribes do you get on average per email sent?
Most marketers use behavior analysis to inform their email marketing campaigns. The reason is likely to be related to the fact it’s easy to get this kind of data. Most email marketing providers show this data right on the dashboard. Since behavior metrics seem so useful, most marketers believe that’s all they need. As Avinash shows, there’s more to analytics than behavior analysis (also known as “clickstream analytics”).
The second element is the “outcome analysis”: the metrics that show what the results of your campaigns are. Outcome analysis allows you to find insights like:
- How many people purchase your products?
- What’s the average revenue per campaign sent?
- What’s the average revenue per subscriber?
- How many people convert into leads?
- What’s the average ROI of the campaigns you send?
While most email marketing managers focus on the clickstream metrics to analyze the results of their campaigns, chief executives care only about the outcomes. Chief executives don’t care about your open rate; they want to see whether they’re making any money with email marketing or not. Showing the outcome metrics to the executive team of your company can change the way they perceive your email marketing efforts and its impact within the organization.
One common problem email marketers face is the problem of induction: How do you know what drives the behavior of your subscribers when you only have data that shows their behavior and not their hidden motivations?
That’s where the final element of the Trinity comes into play: “experience analysis.” Experience analysis explains the why behind the what. As Avinash puts it:
Experience analysis allows us to get into the heads of our customers and gain insight or an a-ha about why they do the things they do.
Experience analysis enables you to understand some of the following problems:
- Why do certain segments have higher open rates than others?
- Why do you get unsubscriptions on every transactional campaign with no discounts?
- Why do you get lower revenue per campaign during certain months of the year?
You can’t get the answers to these questions from your analytics provider; you need to get inside the minds of your customers. You can only achieve that by implementing some of the following analyses:
- Heuristic evaluations (i.e., when usability experts review your site’s interface and compare it against accepted usability principles with the intention of finding a list of potential usability issues)
- Lab testing
- Surveys
- A/B testing

Source: Web Analytics: An Hour A Day
Although the Trinity isn’t a new or revolutionary concept, it can allow you to see beyond the most common analysis you end up doing with the data your email provider gives you. Most importantly, it allows you to see what people do, why they do it, and how that impacts your business.
The question now becomes: what specific data do you need for your campaigns? And, most importantly, how do you get that data?
The key data you need for your email marketing campaigns
In the introduction, I talked about how marketers have access to large amounts of data, and how that’s both a blessing and a curse. It’s highly advantageous to know how people react to your campaigns, but it can also be hard to focus when you have five different metrics that you can use to measure your goal.
The overabundance of metrics and data leads marketers to focus on rather basic metrics, such as open rates and CTR, but that’s far from optimal. For example, how do you know CTR is the metric you need to improve? Most importantly, how could it help you improve the performance of your campaigns?
One useful way to overcome the problem of overabundance of irrelevant data is to focus on what you need for your company and each particular campaign. If you’re an ecommerce marketing manager, some of the metrics that are most relevant to you are:
- Conversion rate
- Average Order Value (AOV)
- Adds to Cart
- Revenue
- ROI
If your goal were to engage, you’d use different metrics to measure your results. The same would apply if you worked for a nonprofit, a retail store, or a SaaS business. As a consequence, there’s no “holy metric” you need to use as a benchmark to measure your success; it depends on your business and your goals.
Another approach that can help is to ask yourself what question you’re trying to answer with each metric you currently use. To find the data you need to improve your campaigns, start with questions that answer knowledge gaps you have about your audience and your past campaigns.
Let’s say you’re an ecommerce B2C manager for a women’s clothing company and you want to launch a holiday campaign with 12 different emails spread out throughout the month of July. You want to showcase your different summer clothes to your subscribers, all of whom are young women. Still, you have some doubts about your audience. You don’t know what age is the most profitable, where these people sign up from, or what locations drive the most conversions.
Some questions you could ask yourself are:
- What’s my audience’s age range?
- What’s the most profitable age segment?
- What pages drive the highest signup rate?
- What do we offer on those pages?
- How large are the cities in which our most profitable sales happen?
- Where does our most profitable segment live?
You can see your most basic metrics from your standard email marketing provider. All of them have an analytics feature which allows you to see metrics, such as open rates and CTR. If you want to dig deeper and see how email affects your overall website, you’ll have to go to your analytics tool, which usually is Google Analytics. Finally, you can get the whole picture, including the whys from the experience analysis, by using tools such as GetFeedback (for surveys), CrazyEgg (for heat maps), and UsabilityTools (for visual in-page analysis).
So far, we’ve seen how to think analytically about your email marketing and how you can find the data you need to improve your campaigns.
Now it’s time to consider four specific ways you can leverage data for your campaigns.
Define and segment your audience.
If you constantly receive irrelevant emails from companies about offers for which you have no interest, it’s likely that you haven’t been properly segmented. This is one of the most common mistakes companies make, both large and small. Despite the fact that segmented and targeted emails generate 58% of all revenue, 42% of marketers still choose not to send targeted email messages.
Ascend2 found the ability to segment email lists and individualize email campaign messaging are the most effective personalization tactics for 51% and 50% of marketing influencers, respectively.
Fortunately, there are only a few ways you can segment an audience, which are based on the following attributes:
- Geographic. This kind of segmentation is usually based on the Census Bureau’s geographic groupings, which start in individual city blocks and then go all the way up to block groups, and finally to Metropolitan Statistical Areas (i.e., large population centers). Some simpler ways to segment an audience is by country, region, population density, city size, and climate zone.
- Demographic. This is the core segmentation based on individual attributes of an audience, which include age, income level, gender, occupation, religion, and marital status, among others. In many cases, you can purchase the demographic data from specific vendors to have it to the individual customer level. Some of these vendors are Experian, Towerdata, and Nielsen, among others.
- Behavioral. Another approach to segmentation involves analyzing transaction data. If you run an ecommerce store, this can be one of the most powerful ways to increase your ROI in a short period. The idea behind this segmentation is to group customers together based on the way they interact with you. According to marketing legend Philip Kotler, typical behavioral variables include user status, loyalty status, buyer readiness, and adopter status, among other variables.
Segmenting your audience is a simple process; you can find your audience’s geographic, behavioral, and part of the demographic information both on your email marketing provider and on your analytics provider. You can also use the power of a tool such as Tagga to add even more behavioral information to your subscribers. What can be challenging is defining what to base your segmentation on and how you’re going to use each segment.
Here’s a good guide by Andrew King about how to use segmentation for your email marketing campaigns.
Tailor your message.
As an email marketer, you spend a great deal of time trying to understand your target audience. You previously learned a few ways to segment your audience. Now you can use the information of each segment to tailor your emails in a way that resonates with each of your subscribers.
The simplest way to do this is to use your segment selection criteria in your message. For example, if the segment you’re sending your message to is made up of families with young children, mention children in your message or include them in your imagery. If you’re targeting customers in a particular geographic region, make sure to mention something about that place in your message.
Time your message.
There’s nothing worse than creating an amazing email that you think your subscribers will love, just to get it ignored due to bad timing. Finding the right time to send emails to your audience can make or break your campaigns.
Nailing message timing depends on your goal and the moment of the month, week, and day you send your emails.
Each list and segment is unique in their own way. You need to test what works best for your goals. If you want to increase sales, test different days of the week, as well as hours, to see what drives the most conversions. If, on the other hand, you want to increase engagement based on the number of opens, you need to test that too. You can use time zone Sending to send your campaign at the same time for each time zone—for instance, 8 a.m. for a breakfast offer, or you could use send time optimization to send at the time that’s best for each subscriber. The latter is better for non-time-sensitive messaging.
Analyze your results and profitability.
The most common way marketers analyze their email marketing campaigns data can be summed up in a three-step process:
- They take all the data for the metrics they focus on, which most commonly are represented by clickstream metrics (like open rate, CTR, and bounce rate).
- They see how these metrics measure both against their benchmark and their desired goal.
- They think of ways to improve each metric to drive better results.
As you’ve seen before, this kind of analysis only takes into consideration a small part of what you can measure. The key to analyzing your results isn’t just to optimize for opens and CTR, but for profitability.
Remember the outcome analysis: What makes your customers purchase your products? What makes your subscribers want to sign up?
Understanding your clickstream data is important. But, instead of taking each metric on its own, think how their performance ties to your revenue and profits. For example, if your open rate improved in your last three campaigns, how did that affect your revenue? If your revenue improved, can you drive a correlation between your open rates and your revenue?
The second key way you need to analyze your results if to profile your current profitable customers and separately analyze each segment. Using all the data at your disposal, you want to find behavioral, demographic, and geographic patterns that relate with your profitable customers. To find these patterns, you need to ask yourself questions like these:
- Do they tend to come from a specific age group?
- Do they tend to have incomes above a certain level?
- Do they tend to have children? If so, what’s their age range?
- Are they concentrated in urban, suburban, or rural environments?
- What’s their marital status?
- Do they tend to buy certain products in particular? Do they belong to a particular category or price range?
- Do they tend to buy products at a particular time of the year?
With this set of data, you can then target acquisition campaigns at people who fit your most profitable customer list. You can also use your customer profiles to help your advertising team choose the best media channels for its messages.
It’s worth mentioning that, once you find your profitable customers, you don’t need to ditch or ignore your unprofitable ones. You can turn your unprofitable customers into profitable ones by expanding your relationship with them.
Expanding your relationship means engaging with your current unprofitable subscribers by offering them content they find interesting, valuable, and even entertaining. You could also send them discounts, although you should proceed with caution. If you send too many discounts, you could end up destroying your profit margins.
Some of your customers, however, will stay unprofitable, no matter what you do. That may mean they never buy from you or buy unprofitable products. Maybe they don’t trust you or they just don’t like your brand. You could use some experience analysis to see why they aren’t profitable. You could also segment them and approach them in a unique way that drives them to purchase.
Using benchmarks to guide your data
Email marketing benchmarks are crucial pieces of data used to help you define the success of your email marketing campaigns. When reviewing email marketing benchmarks, there are two sets that you need to be aware of
1. Your brand’s benchmarks – your brand’s personal benchmarks regarding the key performance metrics we’ve mentioned above (a.k.a. opens, click-through rates, etc.). These benchmarks should be your brand’s averages.
2. Your industry email marketing benchmarks – these are the average benchmarks regarding the same key performance metrics.
Once you’ve collected your brand’s personal email marketing benchmarks, you’ll be able to compare them side by side to your industry’s averages to see just how well you’re performing.
Not sure where your industry stands? We’ve compiled a helpful list of industry averages to help you.
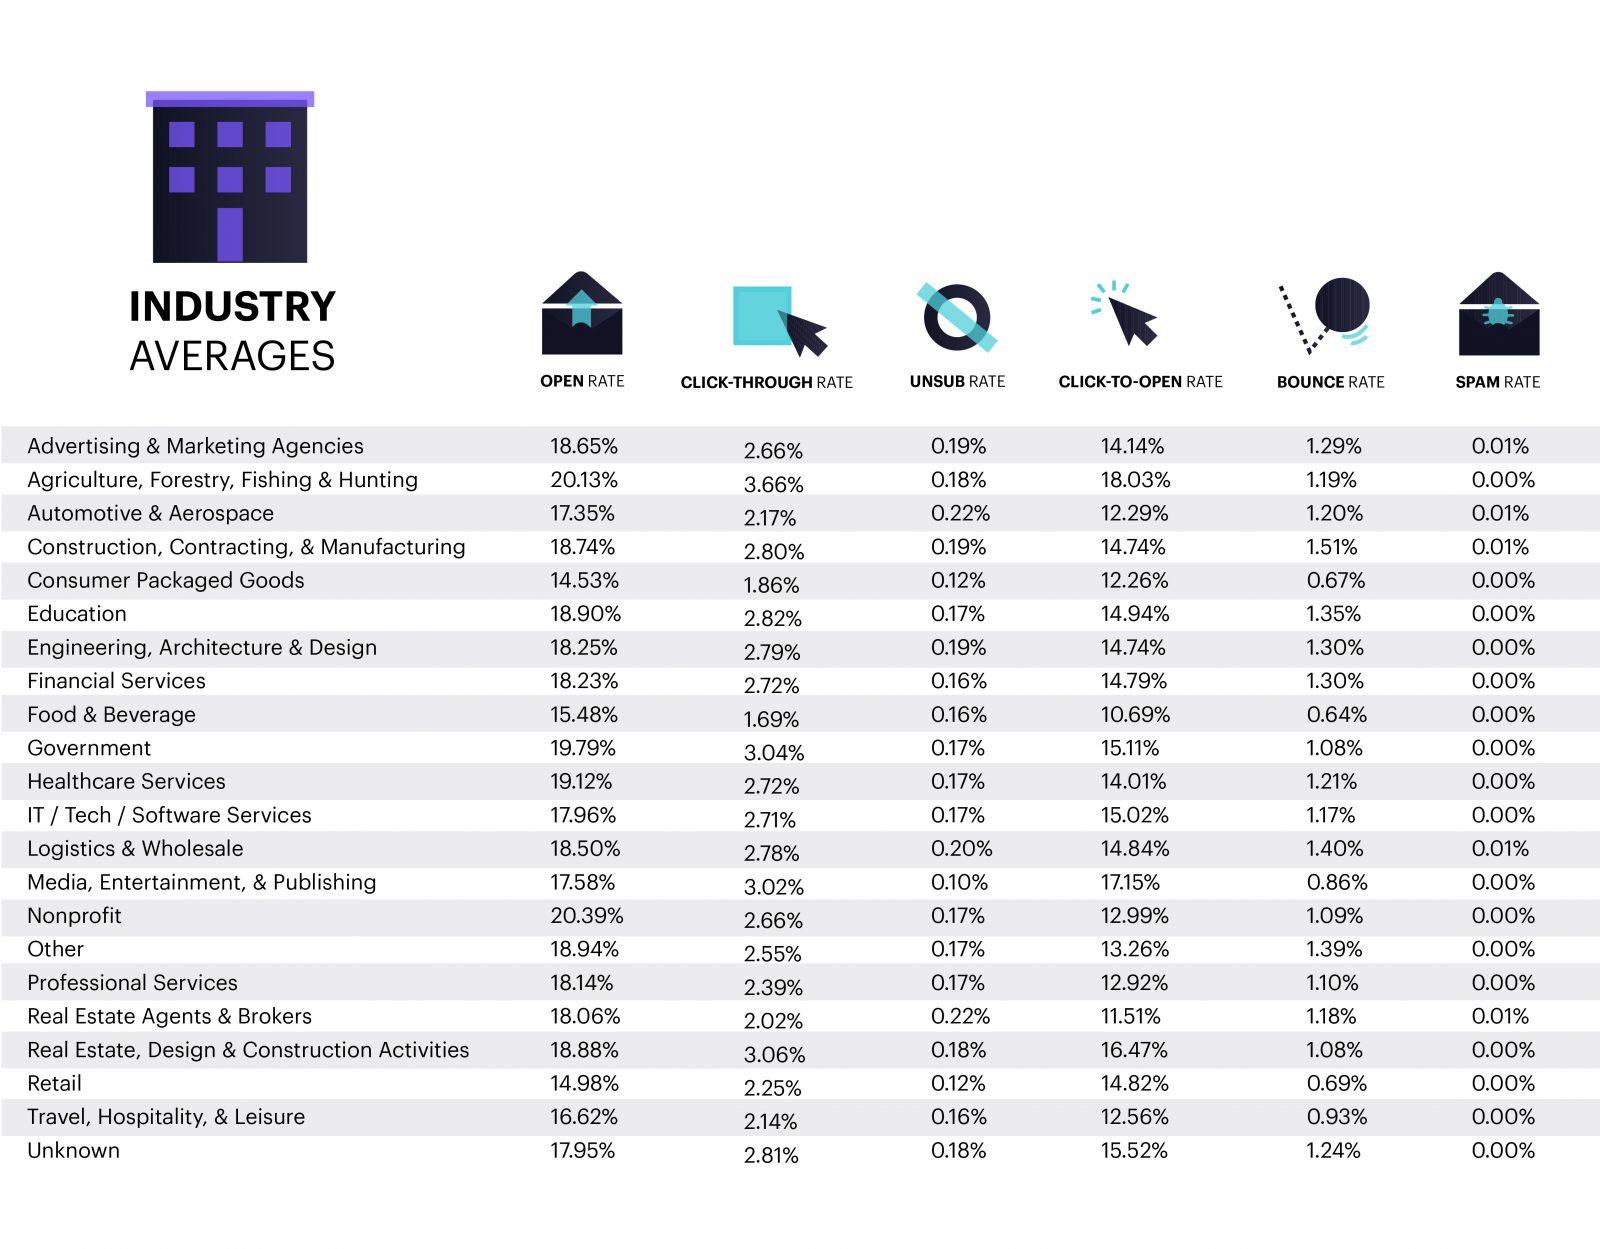
Source: Campaign Monitor
The best way to compare your benchmarks to those of your industry is to compile data over a period of time—say, over a quarter or even a year. Remember, you’re looking for averages over the period of time you’ve chosen.
Not sure how to find averages? Simply go one metric at a time. Take all your email opens over your given period of time, then divide by the total number of campaigns run. That’ll give you the average open rate for that period of time.
Once you have your averages, you can then compare them to the chart above and see where you stand. For example, if you’re in retail and you have an average open rate of 12.78%, then you’re below the industry average of 14.98%. This would indicate that something isn’t quite right with your current email marketing strategy and that you need to take some time to reevaluate your plan of attack.
What if you’re wanting to see how a given automated workflow is performing? The same rules apply, except you’d simply focus on the numbers for that specific campaign. Say you want to see how successful your welcome series is performing compared to the industry averages. All you’d do is take your current data for each metric and compare them to the same industry averages. If your retail brand’s welcome email series has a click-through rate of 3.5%, then it’s safe to assume that your series is performing well above the industry average.
While campaigns and automated workflows are designed to help simplify your day-to-day activities, it doesn’t guarantee that they’ll net you the results you’re looking for. That is why it is essential to stay on top of your data and continuously compare your email marketing benchmarks against your industry’s averages.
Wrap up
In this article, you had a chance to learn how vital it is to think about data analysis for your email marketing campaigns. You’ve seen Avinash Kaushik’s Trinity framework for analyzing the results of your campaign. You then discovered how to define the data you need to use to define the success of your campaigns, while using that information to compare where you stand amongst your industry as a whole. Finally, you’ve seen how to segment your audience, tailor and time your message, and analyze your results using data.
The data you use to drive your campaigns can now help you get the results you desire. When collecting your data, make sure you’re gathering important information on the following metrics:
- Conversion rate
- Average Order Value (AOV)
- Adds to cart
- Revenue
- ROI
Looking for an email marketing software that helps you gather these import pieces of data and helps guide you on how to analyze it? Then schedule your live demo of Campaign Monitor today.