Article first published in July 2015, updated June 2019
You’re sending your email campaigns and newsletters out in regular intervals and looking at your reporting to see what’s working and what could be improved, but do you really know what your email data means?
As a modern marketer, you wear a lot of hats and are in charge of many moving parts of your marketing mix. You can send out campaigns until the cows come home. However, the question becomes: “How is email success measured?” It’s easy for your email marketing data to get lost in all the metrics and KPIs you have to keep an eye on.
In this post, we’ll explain six simple email marketing metrics and how you can use them to improve your email campaigns.
Why is monitoring your email marketing metrics important?
VentureBeat recently conducted a study of 48,000 companies that use email tools and found that marketers aren’t doing a great job at capturing data and applying it to their decision-making.
In fact, 32% of enterprises don’t know which devices their customers are using to open emails, and 29% aren’t tracking revenue through emails, according to the study.
That’s problematic, especially considering email delivers the highest ROI of any marketing channel, and you can get significant gains in conversions by monitoring your analytics and running A/B tests.
How do you evaluate an email marketing campaign?
Email is a marketing channel you definitely want to be tracking and optimizing to ensure you get the best possible results.
However, how do you know what data to track? Moreover, how do you use this data to optimize your campaigns and get better results?
Let’s take a look at six email marketing metrics you should be tracking and how you can use that information to get better results from your email campaigns.
6 common email marketing metrics in your Campaign Monitor reporting
In order to answer the popular question “What is the success rate of email marketing?” you need to first understand each of the KPIs that you’ll be presented with when reviewing your analytics reports.
Depending on the marketing tools your team uses, you could be presented with several different metrics to review. Instead of listing each and every one, we’ve compiled a list of the six most common email marketing metrics that you’ll want to make yourself familiar with.
1. Total opens to date
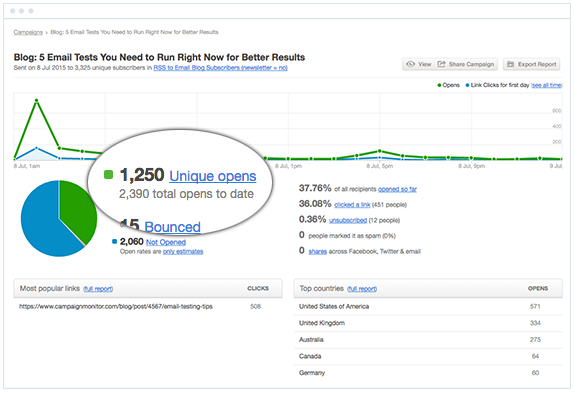
Total opens to date simply means the total number of times your campaign was opened by your recipients. This means that, if you send a campaign to two recipients, and one of them reads your email twice, while the other reads it once, the “total opens to date” will be three.
The total number of opens to date is shown below unique opens:
2. Unique opens
Unique opens don’t take repeat opens from a single recipient into account. So, if you sent a campaign to three different recipients and two of them opened it a total of six times, it’d still show up as two unique opens, as that’s how many individual people opened and viewed your campaign.
How to use this information for better results
Email opens are a good measure of how successful your subject line is at convincing your subscribers to open your email campaigns.
The most popular open rate question is, “What is a good open rate for email marketing?”
While benchmarks do exist, they vary depending on your industry, list size, and how your list was built, so it’s best to monitor your open rates over time and compare them from campaign to campaign. If you’re getting an open rate between 20% and 40%, you’re probably somewhere around average.
If you find your open rates are falling, then you can try using various subject line formulas or power words to help increase them.
3. Bounces
The bounce data tells you the total number of subscribers who didn’t receive the campaign because the email bounced.
One of the most important metrics to monitor after you’ve sent a campaign is the bounce rate, which is calculated by taking the total number of bounced emails and dividing it by the total number of recipients the campaign was sent to.
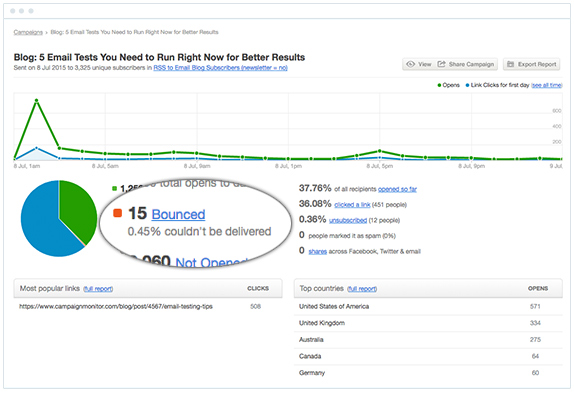
Bounce rates are directly related to the quality of your subscriber list, and low bounce rates (between 2-3%) are a sign of a healthy, permission-based list with active and engaged subscribers.
Bounce rates fall under two different categories:
- Soft bounces
- Hard bounces
A soft bounce is a bounced email that was returned due to a deliverability issue, such as a file that’s too large to send, or the recipient’s inbox being too full. In most cases, these types of bounces will be re-attempted over the course of a few days and may resolve on their own, once the recipient has had time to review their inbox.
A hard bounce is a bounced email that was returned due to a more severe issue, such as an invalid email address. This is a figure that needs to be carefully monitored because it can pull down your metrics.
For a more detailed explanation of the different types of bounces and why your emails may be bouncing, check out this helpful post.
How to use this information for better results
If your bounce rate is topping 3%, it could indicate that there may be problems with the way your list was grown or how it’s being managed.
It’s important that you’re only sending campaigns to people who have specifically opted in to hear from you, and, by following our two-part email list building formula, you can start to build a list of highly engaged subscribers and reduce your bounce rate.
4. Clicked a link
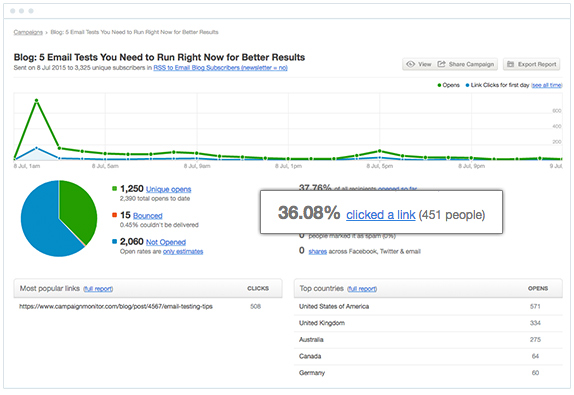
Your click data tells you what percentage of people who opened your campaign went on to click a link.
Email marketing tools like Campaign Monitor will tell you your click-through rate, as well as allow you to dive deeper to determine exactly what links were clicked and what subscribers clicked them.
How to use this information for better results
Knowing which links in your emails are getting clicked is one of the key indicators of your campaign’s success.
Using this information, you can figure out what content resonates most with your subscribers, as well as get a sense of how successful your links and CTAs were. What content did your subscribers click through on? Did they click your text links, your CTA buttons, images, or all of the above? All of this insight can help you choose how to optimize your next email campaign and help continue to improve your click-through rate.
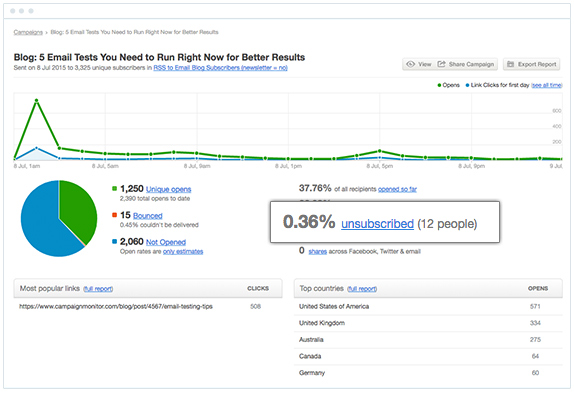
5. Unsubscribed
